Download
1 / 8
80 likes | 182 Vues
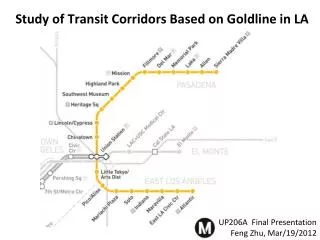
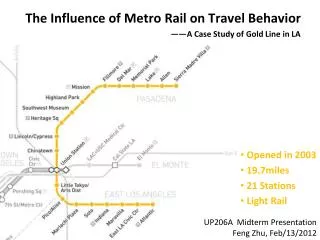
The Influence of Metro Rail on Travel Behavior ——A Case Study of Gold Line in LA. Opened in 2003 19.7miles 21 Stations Light Rail. UP206A Midterm Presentation Feng Zhu, Feb/13/2012. Background

E N D
The Influence of Metro Rail on Travel Behavior ——A Case Study of Gold Line in LA • Opened in 2003 • 19.7miles • 21 Stations • Light Rail UP206A Midterm Presentation Feng Zhu, Feb/13/2012
Background • Study Area: 86 Census Tracts which are within 0.5 miles of the Gold Line Stations. • Research Purpose: Compare travel behavior changes before and after the opening of GL.(From 2000 to 2010) • Two Variables: (1)Commuting Time. (2)% Auto Dependance(Drivealone+Carpool/Total) • Data Source: (1)U.S. Census Bureau:2000 SF3 Sample Data,2010 ACS 5-year estimates. (2)Metro Developer
Skills: (1)Inset Map (2)Geoprocessing-Clip(3)Boundary sub-sets seclections-study area was derived by selecting tracts within 0.5 miles of GoldLine Stations
Skills: (1)Point graduated symbol (2)Creating indices(% Autodependance was derived by drivealone+Carpool/total) • % Autodependance: 77% • Commuting Time: 30mins
Skills: (1)Point graduated symbol (2)Creating indices(% Autodependance was derived by drivealone+Carpool/total) • % Autodependance: 75% • Commuting Time: 28mins
Commuting Time Change(64 tracts) • <0min,30tracts; • >0min, 20tracts; • No Change,5tracts • Skills: (1)Attribute sub-sets section(ShapefileTimechange was derived by reversely selecting field of “trip time” don’t equal to Null)
% Auto Dependance Change(65tracts) • <0,41tracts; • >0,24tracts. • Skills: (1)Attribute sub-sets section(ShapefileTimechange was derived by reversely selecting field of “Auto dependance” don’t equal to Null)
Conclusion • After the opening of GL, there was slight decrease of Auto-dependance and commuting time within station surrounding areas from 2000 to 2010. • But whether it was caused by GL is still uncertain, because it maybe influenced by others factors, such as change of social and economic situations.(Next Step in the Finals) • Skills • Inset Map • Point graduated symbol • Creating indices • Attribute sub-sets selection • Boundary sub-sets selection • Geoprocessing