Characterizing SNPs Using Genomic Information
This study investigates single nucleotide polymorphisms (SNPs) and their association with genetic susceptibility to colon cancer, emphasizing the role of inherited mutations in critical genes like APC. SNPs, the most prevalent polymorphisms in the human genome, occur approximately every 400 bases and are foundational to Genome-Wide Association Studies (GWAS). We analyze SNP variations across different minor allele frequency (MAF) categories, examining their potential impact on disease risk. The study highlights the need for robust methodologies to predict SNP replication rates and target causal variants effectively.

Characterizing SNPs Using Genomic Information
E N D
Presentation Transcript
Characterizing SNPs Using Genomic Information Ivan P. Gorlov, Olga Y. Gorlova & Christopher I. Amos
Colon cancer results from genetic alterations in multiple genes Inherited mutations in the APC gene dramatically increase risk of colon cancer Cancer development reflects early germline susceptibility as well as subsequent mutations that promote cancer
The continuum of variation Linkage Sequencing Association Chung et al.Carcinogenesis 31:111-120, 2010
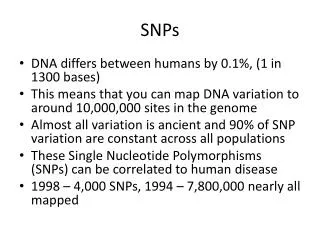
SNPs are the most common type of polymorphism in the human genome • SNPs occur ~ every 400bases • Minor allele frequency describes prevalence of rarer variant (0,0.5] • Very Few (<0.01%) SNPs are associated with diseases • SNPs are the bread of Genome Wide Association Studies (GWAS) • Success requires inference about effects from Causal Variants
GWAS Have Been Highly Successful in Finding Novel Assocations
Manhattan plot of all lung cancers from 1000 Genomes Imputation CHRNA5 hTERT CHEK2 BRCA2 hMSH5 TP63
There are multiple signals on Chr 15q.25 - sequencing of 96 people Intron 4 76668145 Observed in 4 cases Additional variation (small microsatellites and in/dels) in the promoters of both CHRNA5 and CHRNA3
sdSNPs are deleterious enough to impair gene function and increase disease risk. Their effects, however, are not strong enough for selection to eliminate them from population (genetic drift, founder effects, and population bottlenecks are factors that help retain sdSNPs).
Proportions of functional SNPs in different MAF categories We estimated the proportion of nonsynonymous SNPs predicted to be functional by PolyPhen and SIFT in different MAF categories PolyPhen SIFT
The Erudite Hypothesis: • Large fraction of the genetic susceptibility influenced by rare (<5%) variants with relatively strong effect size • Targeting rarer variants for analysis may detect causal variants when sample size is large. The majority of the significant SNPs detected by GWAS are SNPs tagging untyped causal variants – greatly reduces power – but indicates region for further study Brute force analysis is not going to be sufficient to overcome power loss for multiple comparison – have to upweight analyses for most likely causal variants
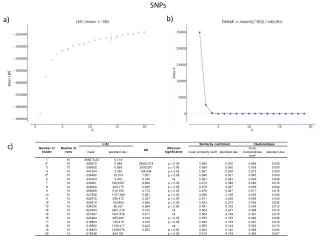
MAF and a Required Sample Size The numbers of cases and controls that are required in an association study to detect disease variants with allelic odds ratios of 1.2 (red), 1.3 (blue), 1.5 (yellow), and 2 (black). Numbers shown are for a statistical power of 80% at a significance level of P <10-6.
SNP Replication Rate • GWAS replication rate is low: about 5% • This suggest that GWAS produce a considerable number of false discoveries • Development of methods to predict which SNP will be replicated and which will not is important – relevant for seq. • We evaluated this approach using the results of published GWASs
Evaluating SNP replications • Retrieved all data from the Catalog of Published GWA Studies (http://www.genome.gov/26525384/), Sep 13 • Restricted analysis to SNPs mapping to a single gene and associated with a disease rather than variation • SNPs related to 106 diseases were studied, 2659 SNPs from 512 studies • SNP findings sorted by date with the first report denoted as a discovery and subsequent studies may be replications • Reproducibility score modeled as the ratio of successful replications over the total number of subsequent studies.
Characteristics Studied 3' UTR, 3' Downstream, 5' Upstream, 5' UTR, Coding nonsynonymous, Coding synonymous, Intergenic, Intronic, Non-coding, and Non-coding intronic.
Further evaluating SNP Type • (1) All pair-wise comparisons inside the group should be insignificant; and (2) All pairwise comparisons between the groups should be significant. • SNP reproducibility was lowest in the group 1 (5’ UTR, Intergenic, 5’ Upstream, Non-coding intronic, Intronic), intermediate in the group 2 (Coding synonymous, 3’ Downstream, Non-coding), and highest in the group 3 (Coding nonsynonymous, 5’UTR). • 43 SNPs had >1 annotation
Identification of Causal Variants • Showing a variants has a causal effect on a disease process is challenging • Good candidate for the causal variant should be linked to relevant biological mechanism. For example it may have effect on gene expression or protein structure/folding. • Functional analysis is needed to prove that (1) SNP change the important biological function, and that (2) alteration of function is associated with disease risk.
Conclusions • Multivariable analysis showed that 11% of variability was explained by SNP predictors with 5% attributed to –log(P) value alone. • SNP characteristics are second most prominent, followed by MAF (in wrong direction for weighting) • Could also define profile measurement
Number of GWA Studies Evaluated Number of Different Diseases Studied Number of Replicates
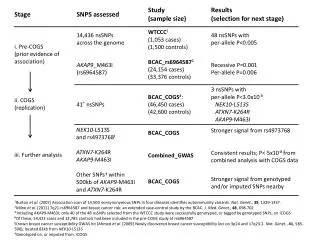
Selecting SNPs for Validation • Selection SNPs for validation stage is tricky • The common approach is based on the ranking SNPs based on P-values from the discovery stage and select the top SNPs • People also take into account the region: SNPs located in the region detected by linkage analysis of associated with genes from candidate pathway are considered to be a good candidate for replication
Are GWAS-Detected SNPs Tagging or Causal Variants • Even large genotyping studies e.g. genotyping 1,000,000 SNPs cover only a fraction of genetic variation in the human genome: there are more than 70,000,000 SNPs in the human genome • Causal variant may or may not be on a genotyping platform but is likely to be captured by sequencing studies • Short repeats are not detectable • Some regions of the genome are not yet mapped • Inversions are difficult to identify
Improving power to detect uncommon variants • Single variant as disease locus* • Hardy-Weinberg Equilibrium in controls • Affection status modeled by a penetrance table. • case-control samples • High risk allele A with frequency p • Low risk allele B with frequency q • Power calculation • actual sample size needed for genotype-phenotype relationship to risk Peng et al. Hum Genet. 2010 Jun;127(6):699-704. *Multiple variants in a region can be modeled using burden tests
Power = 0.8 Relative risk A: 4, Disease prevalence: 0.05,Disease allele frequency: p=0.01, MAF 0.01, significance 1 x 10⁻⁷
GAME-ON Integrative Projects • Discovery, Expansion,and Replication • Find new associations through pooled or meta-analysis • Independent replication studies to confirm genotype-phenotype associations • Fine-map of association signals • Biological Studies • Identify risk-enhancing genetic variants • Examine functional consequences of a genetic variant • Determine biological mechanisms of risk enhancement • Epidemiologic Studies • Evaluate gene-gene and gene-environment interactions • Assess penetrance and population attributable risk • Develop complex risk models • Evaluate clinical/analytic validity of risk models in observational studies
GAME-ON Organizational Structure Lung Prostate Breast Colon Ovarian U19- based on Cancer Sites External Advisory Committee Executive Committee (decisional body) 5 P.I.s NCI program Officers Steering Committee (policies and processes) 2 voting members from each U19 Working Groups Chairs NCI Program Officers Working Groups in areas of interest Epidemiology and Clinical Next Generation Genomics Technologies Analytic and Risk Modeling Functional Assays Epigenetics TERT-CLPTM1L
Clinical and EpidemiologicalWorking Group • Established July 2010; Chairs – Roz Eeles, Rayjean Hung • Major initiatives • Pan-cancer meta-analysis across sites, • Inflammation pathway, • pleiotropy analysis (with PAGE) • Inventory of data and biospecimens • 96,205 cases/241,880 controls • whole blood derived DNA for 70585 cases and 81,673 controls • 3317 fresh frozen tumors • 14,150 FFPE tumors • Virtual pathology network • Managing data harmonization across sites
Analytical and Risk Modeling Working Group • Established July 2010, Chair – Peter Kraft • Held regular webinars about innovative methods • Provided leadership for integration of data from HapMap 2 • Provided guidelines for ongoing imputations of 1000 Genomes imputation • Developed and implemented novel meta-analytical methods • Evaluated approaches for detecting gene x environment effects
Sporadic Lung Cancer Genome Wide Chr 5p Association Wang, et al. Nature Genetics 40(12): 1407–1409 (2008)
There is Marked Heterogeneity in Associations for Chromosome 5p region
Evaluation of 5p Genes as Potential Lung Tumorigenesis Modifiers in a shRNA/ KRASLSL-G12D/+ Mouse Model
Loss of CLPTM1L sensitizes lung tumor cells to genotoxic agents
Prevention and CessationThe Public Health Mission Initiation Cigarette Use Nicotine Dependence Cessation and Remission
Chromosome 15q25 Is Important for Smoking CHRNA5-A3-B4 The Tobacco and Genetics Consortium (2010) Nature Genetics
Genetics of Smoking Cessation • Though the strong genetic effect of the a5 nicotinic receptor contributes to heavy smoking, little to no effect is seen for smoking cessation. Survival Analysis Smoking Cessation N=1,015 University of Wisconsin Timothy Baker and Colleagues Chen et al., 2012
Entire Sample (N=1015) Genetic Effect Seen in the Placebo Group Placebo group (N=117) Treatment group (N=898) UW-TTURC study. Haplotypes based on 2 SNPs (rs16969968, rs680244) H1=GC 20.8% H2=GT 43.7% H3=AC 35.5% Chen et al., 2012
A Significant Genotype by Treatment Interaction Haplotypes (rs16969968, rs680244) H1=GC(20.8%) H2=GT(43.7%) H3=AC(35.5%) OR (Abstinence) Reference Chen et al., 2012 Haplotypes
Haplotypes predict abstinence in individuals receiving placebo medication OR (Abstinence) Chen et al., 2012 Haplotypes
A Significant Genotype by Treatment Interaction (X2=8.97, df=2, p=0.01) OR (Abstinence) Reference Chen et al., 2012 Haplotypes
Haplotypes do NOT predict abstinence in individuals receiving pharmacologic treatment OR (Abstinence) Reference Chen et al., 2012 Haplotypes
Smokers with the high risk haplotype are more likely to respond to pharmacologic treatment OR (Abstinence) Reference Chen et al., 2012 Haplotypes
Smokers with the low risk haplotype do NOT benefit from pharmacologic treatment OR (Abstinence) Reference Chen et al., 2012 Haplotypes
The genotype by treatment effect do not differ across pharmacologic treatments. Abstinence (Proportion) No difference in haplotypic risks on cessation across medication groups (wald=1.16, df=3, p=0.88) Chen et al., 2012
Conclusions • GWAS Studies have been amazingly productive in identifying new genetic architecture of common influences for complex diseases • Evaluating the actual functional effects of identified variants can be challenging, relatively few causal variants are directly identified • Follow-up studies have identified significant effects of genetic loci on cancer development • Genetic loci identified by GWAS analyses have provided insights into cancer prevention • Sequencing is useful but expensive, targeted applications are best