Download
1 / 6
60 likes | 388 Vues
First Snow and Ice ICESat2-Like Data from MABEL William B. Cook, Code 612, NASA GSFC.

E N D
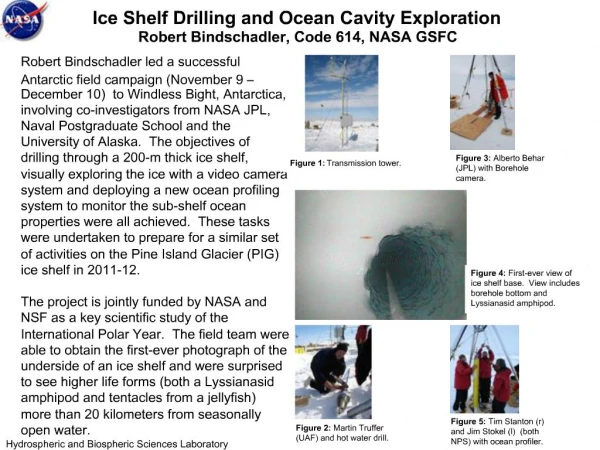
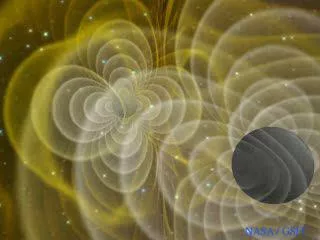
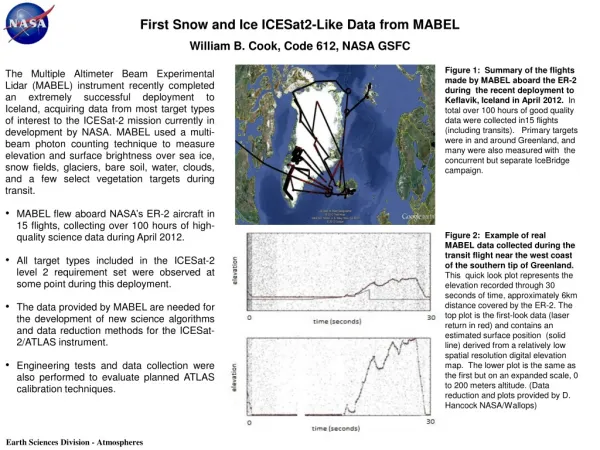
First Snow and Ice ICESat2-Like Data from MABEL William B. Cook, Code 612, NASA GSFC • The Multiple Altimeter Beam Experimental Lidar (MABEL) instrument recently completed an extremely successful deployment to Iceland, acquiring data from most target types of interest to the ICESat-2 mission currently in development by NASA. MABEL used a multi-beam photon counting technique to measure elevation and surface brightness over sea ice, snow fields, glaciers, bare soil, water, clouds, and a few select vegetation targets during transit. • MABEL flew aboard NASA’s ER-2 aircraft in 15 flights, collecting over 100 hours of high-quality science data during April 2012. • All target types included in the ICESat-2 level 2 requirement set were observed at some point during this deployment. • The data provided by MABEL are needed for the development of new science algorithms and data reduction methods for the ICESat-2/ATLAS instrument. • Engineering tests and data collection were also performed to evaluate planned ATLAS calibration techniques. Figure 1: Summary of the flights made by MABEL aboard the ER-2 during the recent deployment to Keflavik, Iceland in April 2012. In total over 100 hours of good quality data were collected in15 flights (including transits). Primary targets were in and around Greenland, and many were also measured with the concurrent but separate IceBridge campaign. Figure 2:Example of real MABEL data collected during the transit flight near the west coast of the southern tip of Greenland. This quick look plot represents the elevation recorded through 30 seconds of time, approximately 6km distance covered by the ER-2. The top plot is the first-look data (laser return in red) and contains an estimated surface position (solid line) derived from a relatively low spatial resolution digital elevation map. The lower plot is the same as the first but on an expanded scale, 0 to 200 meters altitude. (Data reduction and plots provided by D. Hancock NASA/Wallops) Earth Sciences Division - Atmospheres
Name: William B. Cook, NASA/GSFC, Code 612 E-mail: william.b.cook@nasa.gov Phone: 301-614-7123 Additional Credits: Kelly Brunt (615/GSFC & Morgan State U.) provided detailed flight planning and supervised much of the MABEL operation in Keflavik, Iceland. We received excellent support from the ER-2 crew and pilots throughout the mission. Special thanks to Chris Jennison, Tim Moes, Tim Williams, and Stu Broce (all NASA/Dryden). The MABEL team in Iceland also included Eugenia DeMarco, Dan Reed, and Spencer Disque (all from Sigma Space), Bill Hart (SSAI) and Tom Neumann (NASA/GSFC). Also aboard the ER-2 and supporting MABEL during this mission were the Cloud Physics Lidar (CPL) (PI: Matt McGill, NASA/GSFC) and the DCS and DMS camera systems (PI: R. Dominguez, UC Santa-Cruz). Technical Description of Figures: Figure 1: The map does not show the extent of sea ice encountered by MABEL (and IceBridge) during April 2012. The northern and eastern portions of Greenland were surrounded by sea ice extending a few hundred kilometers from the shore. MABEL/ER-2 and the IceBridge/P-3 suite of instruments flew simultaneously over sea ice off the eastern shore of Greenland. MABEL was also able to overfly several other IceBridge flight paths within hours or a day of the IceBridge flights, especially those near the Jakobshavn glacier and the SW of Greenland. One MABEL/ER-2 flight went to Svalbard and overflew ground calibration targets placed especially for MABEL. Figure 2: The MABEL data contain both laser photons and solar reflected photons at wavelengths that allow them to pass through the spectrally narrow etalon filter. The solar photons show up at all elevations since they are continuously produced. Understanding and properly modeling the solar background measured by the altimeter is critical to developing robust algorithms for elevation retrieval. The density of solar photons is indicative of the underlying reflectivity of the surface and the solar zenith angle. At the left of the plot, the reflected solar photon density is very high, indicating a bright surface and/or well illuminated target. The solar photon density is similarly high at the right side of the plot. These data were acquired near dawn local time, and the airplane was flying from west to east, so the right-hand side of the hills was illuminated fully while the left hand sides and the flat regions were not well illuminated. Since the reflected solar signal also drops significantly over the flat region as the aircraft traveled, we conclude that this abrupt change over the flat region corresponds to a short section of surface ice near the left-hand hill that gives way to a larger section of open water (with minimal surface reflection). When the elevation again rises above the flat water region and the ER-2 is again over land, the solar background becomes stronger. Hence MABEL provides information on background reflectivity and target type in addition to elevation. These conclusions are verified by the visual images taken of the terrain (not shown here). Scientific significance: This Greenland campaign was the first concentrated MABEL deployment designed to produce data for algorithm development for ICESat-2/ATLAS, and we now have the first MABEL snow/ice data. ATLAS employs a photon counting lidar technique that differs from the waveform lidar technique used by ICESat/GLAS. Prior MABEL flights were primarily for engineering verification and demonstration of the technique. MABEL’s coincident flight with IceBridge and the flights over targets used by IceBridge provides highly useful information and validation for both missions. Relevance for future science and relationship to Decadal Survey: The data collected by MABEL will enable the development of the science algorithms needed for the ICESat-2 mission. The signal acquired by the photon counting technique to be employed by ICESat-2/ATLAS differs significantly from the signals acquired during ICESat by GLAS, so that new analysis techniques and algorithms are required. MABEL closely simulates the data expected from the ICESat-2/ATLAS instrument in both spatial and temporal formats. During the next few years, we will improve our understanding of MABEL and use it for fundamental science associated with ice, snow, and vegetation in support of the ICESat-2 and other missions. Earth Sciences Division - Atmospheres
The First Study to Suggest Regional Bias Corrections in Wildfire Emissions Estimates for Global Models Mariya M. Petrenko, Ralph Kahn (Code 613), Mian Chin (Code 614), NASA GSFC Emissions of smoke particles from biomass burning (BB) impact air quality, visibility, human health and make important contributions to aerosol climate forcing. These aerosol effects can be dramatic in BB regions and can affect conditions far downwind from the sources due to particle transport. While chemistry transport models are the major tools in studying aerosol environmental impacts, simulations of BB emissions in these models strongly depend on the inventories that provide emission source locations and strengths. However, due to the complex nature of fires and different ways of making estimates, emission amounts differ significantly between these inventories as is shown in Figure 1. One way to constrain emission estimates in the model is to use aerosol observations. We performed a detailed study with 13 global biomass burning emission estimates, including the widely used Global Fire Emission Database (GFED), Quick Fire Emission Dataset QFED used in the NASA’s comprehensive global model GEOS-5, and 11 combinations of satellite products providing burned area and biomass properties usually used to estimate BB emissions. We then used each of these 13 emission estimates as inputs to the global aerosol model GOCART. We compared the simulated aerosol optical depth (AOD), which is a quantity directly related to amount of particles in the atmosphere, to AOD measured from the satellite for 124 fire cases around the globe. Fig.2 highlights regional performance of three out of 12 emission options compared (similar maps are available for all of them), green color in the graphs showing the best comparison between the model and the observation, and blue and red colors showing the cases where the model’s AOD is lower or higher than satellite AOD. This result is extremely important for aerosol modelers who use these inventories, and for inventory developers, who aim to improve their products. Figure 1: Total global emission of black carbon (BC) during 2006, estimated by 13 emission options. The colors show the contribution to emissions from different vegetation types, which are defined by Global Land Cover (GLC) dataset. Figure 2: Ratio of average GOCART-simulated to MODIS-measured AOD for each studied fire case. Boxes colored in green show the cases where the modeled and observed AOD agree well. Blue boxes are where the model underestimates MODIS AOD, and red – where the model overestimates. The maps are labelled by the BB emission option (described in detail in the referenced paper). Earth Sciences Division - Atmospheres
Name: Mariya Petrenko, NASA/GSFC, Code 613 and Universities Space Research Association (formerly Purdue University) E-mail: mshcherb@purdue.edu Phone: 301-614-6867 References: 1. Petrenko, M. M., R. Kahn, M. Chin, A. Soja, T. Kucsera, and Harshvardhan (2012). The use of satellite measured aerosol optical depth to constrain biomass burning emissions source strength in the GOCART model. J. Geophys. Res., in review. Data Sources: Global Fire Emission Dataset (GFED); Global Land Cover (GLC2000) map and associated biomass properties and emission factors; Carbon consumption database from Weather- and Ecosystem-based fire emissions (WEB-FE) developed at NASA by Soja et al. (pers. comm.) MODIS level 2 fire products: active fire counts (MOD14/MYD14) and collection 5 burned area (MCD45A1) used to calculate fire emission estimates. MODIS AOD product (MOD04/MYD04). MISR Aerosol and stereo height products, and CALIPSO vertical feature mask to confirm plume height. Technical Description of Figures: Figure 1: Total global emission of Black Carbon (BC) during the full year 2006 as estimated by 13 emission options used for comparison in this study. The colors of the stacked bars represent contributions to BC emissions from areas covered by different vegetation types . The colors and the vegetation map are defined by the Global Land Cover (GLC) dataset (http://bioval.jrc.ec.europa.eu/products/glc2000/data_access.php). The figure emphasizes the large difference between the highest and the lowest global BC emissions estimate (a factor of 8 for 2006). Regional differences can be even higher, as can be deduced from the similarly colored portions of the bars. Figure 2: 12 of the 13 emission options were used as sources of BB aerosol in the global Goddard Chemistry Aerosol Radiation and Transport (GOCART) model, and the simulated average AOD for each of 124 fire cases was compared to MODIS-measured average case AOD’s. MODIS AOD was one of the parameters used in the production of the QFED inventory, so the QFED-based model run was not used for this analysis. The ratios of GOCART to MODIS average AOD are colored in blue tones for the cases where the model underestimated MODIS AOD, red where it over-estimates MODIS AOD, and green where it is within about 20% of MODIS AOD. Deeper blue or red tones indicate larger ratios. Such comparisons reveal spatial regional biases in each emission inventory (only three out of 12 studied emission options are shown in Fig. 2 as an example). Scientific significance: Precise representation of BB emissions in the chemistry transport and climate models is crucial because they are among the components affecting global climate and Earth radiative budget. Global emission inventories that provide BB source location and strength to these models are diverse. This is the first study to comprehensively compare several widely used BB aerosol emission inventories on several scales, providing insight into possible sources of discrepancies, and suggesting an approach to correcting regional biases and using satellite-measured AOD to constrain strength of individual fire sources. This work provides a reference for both emission inventory developers and modelers who use these estimates. Relevance for future science and relationship to Decadal Survey: This work is an important step toward improving BB emission estimates in the global models, which in turn is a step toward reducing the uncertainty in aerosol climate forcing calculations. The Decadal Survey ACE mission’s multi-angle imaging polarimeter will provide AOD as well as aerosol type maps at similar spatial resolution to MODIS, extending the data record for BB plumes, and providing a further step in constraining aerosol source strengths globally. Earth Sciences Division - Atmospheres
NASA’s Aura Satellite Illuminates the Signature of ENSO in Lower Atmospheric OzoneLuke Oman, Anne Douglass, Jerry Ziemke, and Jose Rodriguez, Code 614, NASA GSFC El Niño Southern Oscillation (ENSO) is the episodic warming or cooling of sea surface temperatures in the eastern and central equatorial Pacific and the dominant mode of interannual tropical variability. Influencing the thermal, dynamical, and chemical composition of the troposphere. The response of tropospheric to lower stratospheric ozone to ENSO is derived using measurements from the Microwave Limb Sounder (MLS) and Tropospheric Emission Spectrometer (TES) onboard NASA’s Aura satellite. The ozone sensitivity to ENSO represents how ozone responds to a change in the Niño 3.4 Index, which in this case is for 1 K warming or El Niño. Tropospheric ozone is an important greenhouse gas and source of the hydroxyl radical which determines the oxidizing capacity of the troposphere. Simulations using the Goddard Earth Observing System (GEOS) version 5 chemistry-climate model (CCM) forced with observed sea surface temperatures can largely reproduce this result. Tropics Eastern and Central Pacific MLS TES Figure 1: Left: Ozone sensitivity (%/K) to ENSO over the tropics (averaging from 15°S-15°N) from MLS and TES measurements shown as color filled contours overlaid by GEOS CCM simulated (black contours) ozone sensitivity to ENSO. Right: Ozone sensitivity (%/K) to ENSO over the eastern and central Pacific (averaging from 180°W-110°W). The dashed black curve is the simulated tropopause. Earth Sciences Division - Atmospheres
Name: Luke Oman, NASA/GSFC, Code 614 E-mail: luke.d.oman@nasa.gov Phone: 301-614-6032 References: Oman, L.D, J.R. Ziemke, A.R. Douglass, D.W. Waugh, C. Lang, J.M. Rodriguez, and J.E. Nielsen (2011), The Response of Tropical Tropospheric Ozone to ENSO. Geophys. Res. Lett., 38, doi:10.1029/2011GL047865. Oman, L.D, A.R. Douglass, J.R. Ziemke, J.M. Rodriguez, D.W. Waugh, and J.E. Nielsen (2012), The Ozone Response to ENSO in Aura Satellite Measurements and a Chemistry-Climate Simulation. J. Geophys. Res., in preparation. Data Sources: Aura Microwave Limb Sounder (MLS) and Tropospheric Emission Spectrometer (TES). Technical Description of Figures: Figure 1: The ozone sensitivity to ENSO is derived using deseasonalized MLS and TES monthly ozone measurements. Multiple linear regression is used with three predictor variables, the Niño 3.4 Index, and the first 2 empirical orthogonal functions of the Quasi-biennial Oscillation (QBO). The resulting regression coefficient (ozone sensitivity) for the Niño 3.4 Index is shown as the color filled contours (only for values significant above 1 standard deviation). This particular version of GEOS CCM does not simulate the QBO so a linear regression was done against the Niño 3.4 Index using deseasonalized ozone from a 25 year simulation forced with observed sea surface temperatures. The regression coefficient from the simulation is overlaid as black contours. The left panel shows the ozone sensitivity (%/K) to ENSO over the tropics (averaging from 15°S-15°N) and the right panel shows the ozone sensitivity (%/K) to ENSO over the eastern and central Pacific (averaging from 180°W-110°W). Changes as large as -20%/K are found over the tropical Pacific near the tropopause and increases of 4 to 8%/K are seen in the midlatitude Pacific near the tropopause and throughout much of the troposphere over Indonesia and the Indian Ocean. MLS measurements are taken from level 2 version 3.3 from Aug. 2004 – Mar. 2012 and TES measurements are from the level 3 version 2 product from Sept. 2004 – Dec. 2009. The typical range of the Niño 3.4 Index is about 3 K from a moderate La Niña to a moderate El Niño. Scientific significance: The El Niño Southern Oscillation (ENSO) is the dominant mode of tropical variability on interannual timescales. It is well known to have significant influence on the Walker Circulation in the tropical Pacific. Large perturbations to the circulation as well as resulting changes in water vapor can change ozone concentrations in the lower atmosphere. The largest changes in ozone from ENSO are seen near the tropopause which is a particularly sensitive region of our climate system. Ozone is an important greenhouse gas and changes in its amount especially in the upper troposphere influence radiative forcing at the surface. Ozone is also an important source of the hydroxyl radical (OH) which can impact the oxidizing capacity of the troposphere and the lifetimes of some greenhouse gases. Observations of the ozone sensitivity could provide a useful way to evaluate the representation of processes such as ENSO in chemistry-climate models. Relevance for future science and relationship to Decadal Survey: A continuation of the ozone profile record from NASA’s Aura satellite using instruments like MLS and TES will help to continue to refine the derived ozone sensitivity and help to separate its signal from other known processes impacting ozone. Future missions like the proposed Tier 3 Global Atmospheric Composition Mission (GACM) which will measure the vertical profile of ozone distribution especially in the upper troposphere and lower stratosphere will be very important in examining the vertical structure of these changes especially in regions showing large gradients in ozone sensitivity. Earth Sciences Division - Atmospheres