Download
1 / 1
10 likes | 154 Vues

E N D
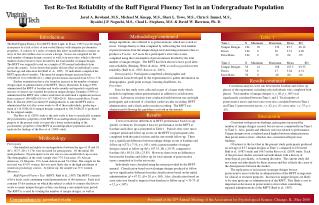
The Ruff Figural Fluency Test (RFFT; Ruff, Light, & Evans, 1987) was developed in response to a lack of tests of non-verbal fluency with adequate psychometric properties. It consists of a series of stimuli that allow an individual to connect an array of five dots within a box to create a design. Scores are computed for the total number of unique designs created, as well as an error ratio, which is the total number of perseverative errors divided by the total number of unique designs. The RFFT was originally tested on a sample of 358 normal individuals from across the country. It was shown that gender did not affect an individual’s score, but that age and education did (Ruff et. al., 1987). 95 individuals completed the RFFT again after 6 months. The mean for unique designs increased from 100(SD=21.8) to 108(SD=22.1), while perseverations increased from 6.53 to 7.76. Further examinations have also found an increase in the number of unique designs upon re-administration of the RFFT. Basso, Bornstein, & Lang (1999) administered the RFFT at baseline and twelve months and reported a significant increase of almost one standard deviation in unique designs. Demakis (1999) re-administered the RFFT after a three week interval and found a significant increase from a mean of 100.9(SD=24.5) to 117.7(SD=26.9). Most recently Ross, Foard, Hiot, & Vincent (2003) recruited 95 undergraduates to take the RFFT and re-administered the test after seven weeks to 48 of those individuals; producing a mean of 114.5(SD=24.6) unique designs compared to 106.3(SD=23.1) produced by the original sample. The Ross et al. (2003) study is the only study to date to specifically examine the psychometric properties of the RFFT in an undergraduate population. The purpose of the present study is to provide a better understanding of the psychometric properties of the RFFT in an undergraduate population and to replicate the findings of the Ross et al. (2003) study. • Test Re-Test Reliability of the Ruff Figural Fluency Test in an Undergraduate Population Jared A. Rowland, M.S., Michael M. Knepp, M.S., Sheri L. Towe, M.S., Chris S. Immel, M.S., Ryoichi J.P. Noguchi, M.S., Chad L. Stephens, M.S. & David W. Harrison, Ph. D. Methodology continued Introduction Table 1 design repetitions, also referred to as perseverations, which are scored as errors. Design fluency is then computed by subtracting the total number of perseverations from the unique design total and using normative data to produce a T score. A T score for a participant’s error ratio is also computed using the total number of perseverations divided by the total number of unique designs. The RFFT has been shown to have good inter-rater reliability (Berning, Weed, & Aloia, 1998) as well as good test-retest reliability (Ruff et al., 1987; Ross et al., 2003). Demographics Participants completed a demographic and information form developed by the experimenters to gather information on demographics, grade point average, learning disabilities, etc. Procedure Data for this study were collected as part of a larger study which included completing online questionnaires in addition to an laboratory session. Laboratory sessions were conducted with between one and eight participants and consisted of a baseline cardiovascular recording, RFFT administration, and a final cardiovascular recording. The RFFT was administered following the guidelines set forth in the manual. Time 1 N Minimum Maximum Mean SD Unique Designs 184 29 154 83.7 26.12 Errors 184 0 30 3.51 4.26 Error Ratio 184 0 .33 .04 .05 Time 2 N Minimum Maximum Mean SD Unique Designs 38 41 168 107.5 29.35 Errors 38 0 17 3.84 4.31 Error Ratio 38 0 .20 .04 .04 Results continued Correlation analyses were run between the baseline and follow up phases of the experiment, including only individuals who completed both phases. Total number of unique designs (r=.86, p<.005) was significantly correlated between Time 1 and 2. Total number of perseverative errors and error ratio were also correlated between Time 1 and Time 2 (perseverative errors, r=.42, p<.01; error ratio, r=.33, p<.05). Results Discussion T-tests revealed no differences in RFFT performance based on age, gender, or ethnicity. Descriptive data for performance on the RFFT at baseline and follow up is presented in Table 1. Paired t-tests were run to compare initial and follow up scores on the RFFT for participants who completed both the initial session and the one-month follow-up. There was a significant difference between unique design scores at baseline and follow up (t[37] =7.50, p<.001), with a greater number of unique designs created at follow up (M=107.53, SD=29.35) compared to baseline (M=89.24, SD=23.85). However, there were no differences between the baseline and follow up for total amount of perseverative errors committed or for the error ratio. Individuals were classified using the norms provided by the RFFT manual. Classification based on total unique designs produced at follow up was significantly different from the classifications based on the initial administration (χ2 = 47.32, df = 20, p<.005). Also, classification based on error ratio was found to improve from baseline to follow up (χ2 = 30.75, df = 12, p<.005). Consistent with previous findings, participants increased the number of unique designs created, but not errors committed from Time 1 to Time 2. Also, gender and ethnicity were not related to performance. Unique designs were correlated much higher between administrations than perseverative errors, which is also consistent with previous findings. Of interest is the fact that in the present study participants produced an average of 83.7 unique designs at Time 1, compared to 100 in the Ruff et al. (1987) study and 106.3 in the Ross et al. (2003) study. Each of the previous studies screened out individuals with a history of neurological, psychiatric, or learning disorders. The current study did not screen out individuals for these reasons and this is likely the cause of the discrepancies between the studies. The replication of an increase in unique designs but not perseverative errors with the re-administration of the RFFT is important for clinical or research purposes. Increases in unique designs are likely to be seen upon any re-administration of the RFFT. This likely is not as important as decreases in perseverative errors when considering repeated administrations of the RFFT (Ruff et al., 1987). Methodology Participants One-hundred and eighty-six undergraduates between the ages of 18 and 24 (M = 18.75, SD = 3.176) were recruited for participation. . Of the initial 186 undergraduates, 38 participants were also run at a one-month follow-up session. The demographics of the study sample were 77% Caucasian, 4% African-American, 1% Hispanic, 15% Asian-American and 3% Other. The sample for the first trial was 65.8% women, this was most likely due to the high enrollment of women in psychology courses. At follow-up, the sample was 71% women. Measures Ruff Figural Fluency Test(RFFT; Ruff et al., 1987) The RFFT consists of five trials, each containing varied presentations of dot matrices. Each trial contains 35 dot matrices on which the subject is asked to connect the dots to create as many unique designs as they can during a one-minute time period. The RFFT is scored by totaling the number of unique designs, as well as Correspondence to: jarowlan@vt.edu Presented at the 20th Annual Meeting of the Association for Psychological Science, Chicago, IL, May 2008