Download
1 / 28
350 likes | 874 Vues
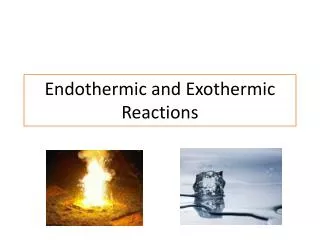
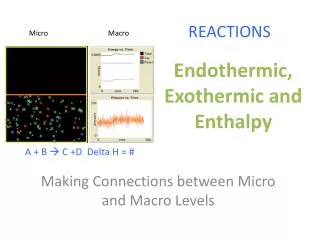
Exothermic and Endothermic Reactions. Linking Energy Profile Diagrams to Thermometer Readings. Candidates should be able to:. (a) describe the meaning of enthalpy change in terms of exothermic (ΔH negative) and endothermic (ΔH positive) reactions

E N D
Exothermic and Endothermic Reactions Linking Energy Profile Diagrams to Thermometer Readings
Candidates should be able to: (a) describe the meaning of enthalpy change in terms of exothermic (ΔH negative) and endothermic (ΔH positive) reactions (b) *represent energy changes by energy profile diagrams, including reaction enthalpy changes and activation energies (see 6.1(c)) (c) describe bond breaking as an endothermic process and bond making as an exothermic process (d) *explain overall enthalpy changes in terms of the energy changes associated with the breaking and making of covalent bonds (e) describe combustion of fuels as exothermic, e.g. wood; coal; oil; natural gas; hydrogen (f) describe hydrogen, derived from water or hydrocarbons, as a potential fuel for use in future, reacting with oxygen to generate electricity directly in a fuel cell (details of the construction and operation of a fuel cell are not required) (g) name natural gas, mainly methane, and petroleum as sources of energy
THE CONCEPT OF ENTHALPY CHANGE In chemical reactions, we can measure changes in terms of energy. We cannot measure the total amount of energy in the beginning, we also cannot measure the total amount of energy in the end. We can measure the change in energy, we call this change the enthalpy change (or heat of reaction).
Reactants + Products Initial temperature 25oC Exothermic Reaction 25oC
Exothermic Reaction 25oC
Exothermic Reaction temperature 32C 25C time Reactants give out energy to the surroundings
Products ΔH is negative Exothermic Reaction • Reactants give out energy to the surroundings • Temperature of surroundings increase • Energy of reactants decrease Energy of reactants Temperature (surroundings) 32C Reactants 25C
Energy Levels Exothermic reactions • Energy is given out • The products have less energy than the reactants Combustion and neutralisation are exothermic
Energy Level Diagrams Exothermic reactions energy course of reaction
Energy Level Diagrams Exothermic reactions energy reactants course of reaction
Energy Level Diagrams Exothermic reactions energy reactants products course of reaction
Energy Level Diagrams Exothermic reactions energy given out ∆H is negative energy reactants products course of reaction
Reactants + Products Initial temperature 25oC Endothermic Reaction 25oC
Endothermic Reaction 25oC
Endothermic Reaction temperature 25C 19C time Reactants take in energy from the surroundings
Products Endothermic Reaction • Reactants take in energy from the surroundings • Temperature of surroundings decrease • Energy of reactants increases Energy of reactants Temperature (surroundings) 25C ΔH is positive Reactants 19C
Energy Level Diagrams Endothermic reactions • Energy is taken in • The products have more energy than the reactants The energy is taken in from the surroundings
Energy Level Diagrams Endothermic reactions energy
Energy Level Diagrams Endothermic reactions energy course of reaction
Energy Level Diagrams Endothermic reactions energy reactants course of reaction
Energy Level Diagrams Endothermic reactions energy products reactants course of reaction
Energy Level Diagrams Endothermic reactions energy products energy taken in ∆H is positive reactants course of reaction
EXOTHERMIC & ENDOTHERMIC PROCESSES Examples: Exothermic processes Gas Liquid Solid Combustion of fuels (e.g. wood; coal; natural gas) Neutralisation reactions ( acid + base) Solid Liquid Gas Dissolving of ammonium chloride or ammonium sulphate crystals in water Thermal decomposition CaCO3 CaO + CO2 Endothermic processes
∆H How much energy is given out or taken in? • Energy is needed to break chemical bonds • Energy is given out when bonds are made ∆H is the differencebetween the energy needed to break the bonds in the reactants, and the energy given out when new bonds are made in the products
Bond energies The energy needed to break a chemical bond • Different chemical bonds have different bond energies
Bond energies 2H2 + O2 2H2O Stage 1: Bond breaking H H H H H H H H H H O O O O H H +436kJ +498 kJ +436kJ Stage 2: Bond forming -464kJ -464kJ O O -464kJ -464kJ
Working out ∆H Summary • The energy values have units of kJ/mole • In the exam, you will be given the energy values and all the bonds to make or break • Energy goes in to break bonds • Energy goes out when bonds are made