Source: CRU/MetOffice, UK
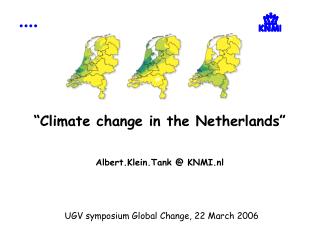
“Climate change in the Netherlands” Albert.Klein.Tank @ KNMI.nl UGV symposium Global Change, 22 March 2006. Source: CRU/MetOffice, UK. Since 1975, warming dominates in all seasons, except Autumn. Source: Klein Tank, 2004. Source: IPCC, TAR, Chapter 2, 2001. upper 10-ptile 1961-1990

Source: CRU/MetOffice, UK
E N D
Presentation Transcript
“Climate change in the Netherlands”Albert.Klein.Tank @ KNMI.nlUGV symposium Global Change, 22 March 2006
Since 1975, warming dominates in all seasons, except Autumn Source: Klein Tank, 2004
upper 10-ptile 1961-1990 the year 1996 lower 10-ptile 1961-1990
“cold nights” upper 10-ptile 1961-1990 the year 1996 lower 10-ptile 1961-1990
“warm nights” “cold nights” upper 10-ptile 1961-1990 the year 1996 lower 10-ptile 1961-1990
Station De Bilt (The Netherlands) warm nights cold nights
Observed trends (days per decade)for 1951 to 2003 Alexander et al., J.Geophys.Res., 2006
3x 6x Day-count indices of extremes Relation between relative trend bq/X required for 80% detection probability (5% level) and series length N for extreme events with average return period Tret Source: Klein Tank and Können, J. Climate, 2003
Geostrophic winds based on pressure triangles; blue circles are 95th and red crosses 99th percentiles (standardized units) updated from: Alexandersson et al., Climate Res., 2000
Wind study the Netherlands 1962-2002 Smits, Klein Tank, Können, Int.J.Climatol., 2005
2) Determine fraction of total precipitation in each year that is due to these days 3) Trend analysis in series of fractions Precipitation fraction due to very wet days 1) Identify very wet days using a site specific threshold = 95th percentile at wet days in the 1961-90 period
“Amplified” response of very wet days (trends over last 50 yr) Groisman et al., 2005
Temperature Source: IPCC TAR, 2001
+5.8°C +1.4°C Source: IPCC AR4 simulations (partly available at: climexp.knmi.nl)
Sea level change globally Departures in the Eastern North Atlantic Source: Katsman, 2006
Summer precipitation change in Hadley Centre climate model simulations red = seasonal total precipitation blue = daily extremes
CHALLENGE project (62 model-simulations of August rainfall totals in NL) simulation 7 simulation 19 Source: Selten, Dijkstra, Kliphuis, et al., CLIVAR, 2003
KNMI will soon present new climate change scenarios for the Netherlands, which replace the WB21 scenarios from 2000: 29 May 2006 THANKS ! htpp://eca.knmi.nl http://www.knmi.nl/scenarios mailto: Albert.Klein.Tank @ KNMI.nl


![[f´‚nE˘RIks]](https://cdn0.slideserve.com/1072532/f-ne-riks-dt.jpg)


![[f´‚nE˘RIks]](https://cdn2.slideserve.com/5310017/f-ne-riks-dt.jpg)