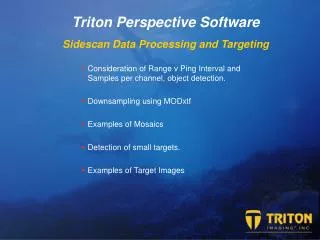
Triton Perspective Software Sidescan Data Processing and Targeting
Triton Perspective Software Sidescan Data Processing and Targeting. Consideration of Range v Ping Interval and Samples per channel, object detection . Downsampling using MODxtf Examples of Mosaics Detection of small targets. Examples of Target Images. Triton Perspective Software

Triton Perspective Software Sidescan Data Processing and Targeting
E N D
Presentation Transcript
Triton Perspective Software Sidescan Data Processing and Targeting • Consideration of Range v Ping Interval and Samples per channel, object detection. • Downsampling using MODxtf • Examples of Mosaics • Detection of small targets. • Examples of Target Images
Triton Perspective Software Sonar Range v Ping Interval • Conventional Side Scan Sonars are limited in their resolution in the along-track direction due to the time taken for each ping to reach the end of the record. • For a sonar range of 100m the sound must travel 100m to the end of the range, be reflected, and then another 100m back. Total distance = 200m. The speed of sound in water is around 1500m/S (or 1.5meters per Millisecond) so each ping requires 200/1.5 seconds (133mS). The maximum number of pings per second is 1000/133 or around 7 pings every second. • Vessel survey speeds are about 4.5 knots or 2.25 meters/sec, this means that during a 100m range survey SSS pings are about .3m apart.
Triton Perspective Software Detection of small objects • It is generally recognized that in order to reliably detect an object on the seabed using a conventional Side Scan Sonar the object must bee “seen” by three successive sonar pings. • If the sonar range is 100m the pings are 0.3m apart, so the smallest object that can bee seen is about 1m long. • Clearly to reliably detect objects smaller than1m in size (or to see more detail in a 1m object ) we need to do one of two things: • Go slower or ping faster. • Travelling more slowly is possible but steering the vessel becomes a problem, the course becomes erratic and this causes the towfish to become unstable which degrades the image. • Pinging faster works of course, if we reduce the sonar range to 50m the ping interval becomes 66ms, we get 14 pings per second and in theory we can detect an object 0.5m in length. • But we need more survey lines to cover the same area.
Triton Perspective Software Maximum useful range • Basic rule of all sonars: Higher Frequencies give better resolution but shorter usable range. Lower Frequencies travel further but have lower resolution. • HF channel, useful range about 55m LF channel, useful range about 70m • If the maximum useful range is 50m, reduce the sonar range to 50m and take advantage of the higher ping rate! • If higher resolution is required, reduce the range further.
Triton Perspective Software Along track resolution versus across track • While the along track resolution is limited by the ping interval and the vessel speed, the across track resolution may be much higher. • Some modern sonars have a very large number of samples per channel. • For example in the previous images the LF channels have 9258 samples per channel and the HF channels 11574. • In theory this would give a resolution of between 10 and 12 mm • In practice, as we have seen the limiting factor is the along track resolution, indeed trying to create an image that has pixels that are equivalent to 250 mm on one axis and only 12 mm on the other axis does not make for coherent images. • Even though all these thousands of samples cannot be used, each and every sample must be read by the processing software.
Triton Perspective Software Downsampling the data • To speed up processing and to better handle the data we should consider reducing the number of samples in each channel. • The original files are not lost and may be useful for other types of processing. • Included with the Triton Perspective software is a program called MODxtf.exe • Select the XTF files to be processed and enter the desired number of samples. • Any number may be entered, but 2048 is suggested. • Processing is fast and multiple XTF files can be processed
Triton Perspective Software Comparison of downsampled data High Frequency (Channels 3 and 4) • Original Downsampled 2048 • (Mosaic resolution is 0.05m in both images)
Triton Perspective Software Comparison of downsampled data Low Frequency (Channels 1 and 2) • Original Downsampled 2048 • (Mosaic resolution is 0.05m in both images)
Triton Perspective Software Small Object detection • In this image from the HF downsampled data two small objects can be seen. • The red lines are “beam lines” that represent each sonar ping. • In this image each “beam line” is about 0.4m apart vessel speed around 7kts. • The object on the left is intersected by 4 pings the one on the right by 3 this is probably the limit of reliable detection.
Triton Perspective Software Small Object detection • The two small objects from the previous image as seen in Triton’s TargetOne • The two images on the left are from the original data. • The two on the right are from the downsampled data.
Triton Perspective Software Sidescan Data Processing and Targeting • Conclusion: • While at first sight it might seem a good idea to have as many samples as possible per channel in our side scan data, the very large aspect ratio of the pixels in the final image can create problems when attempting to create a coherent, human–readable image. Also the time taken to process these vary large data files will be much greater.