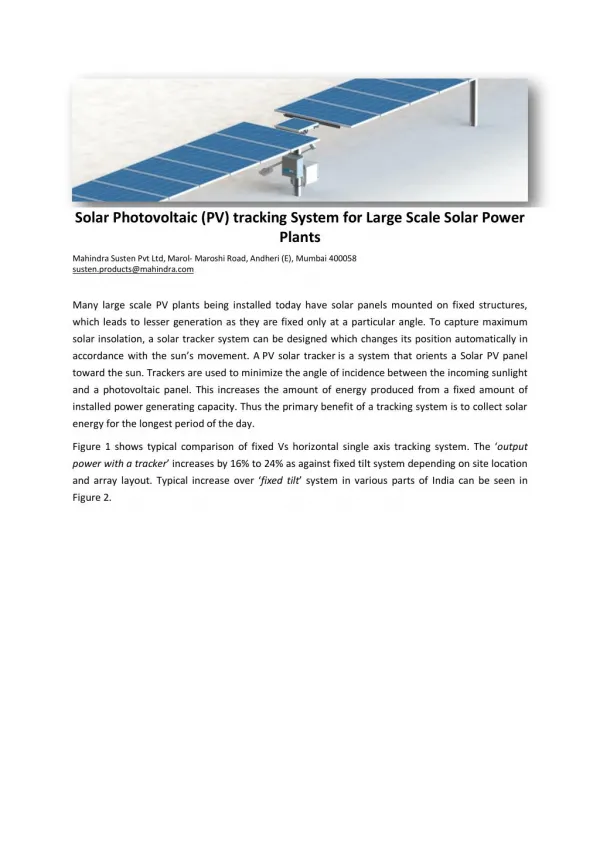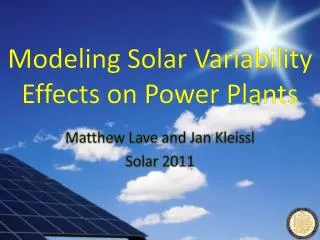
Modeling Solar Variability Effects on Power Plants
200 likes | 361 Vues
Modeling Solar Variability Effects on Power Plants. Matthew Lave and Jan Kleissl Solar 2011. Variability Reduction through Aggregation. Relative Output. Large ramps are detectable real-time by satellite and ground stations

Modeling Solar Variability Effects on Power Plants
E N D
Presentation Transcript
Modeling Solar Variability Effects on Power Plants Matthew Lave and Jan Kleissl Solar 2011
Variability Reduction through Aggregation Relative Output Large ramps are detectable real-time by satellite and ground stations Variability models primarily needed for large central power plants / microgrids
Variability Model • Method to estimate aggregated PV plant output variability given a single point sensor measurement • Model requirements: • Universal: work for plants of any size, at any location, with any arrangement of PV panels • Account for different variability at different timescales • Applications: • Estimate variability of output from distributed and central PV plants to determine grid impacts • Generate virtual PV output for renewable grid integration studies • Estimate benefits of various capacities of energy storage in reducing ramp rates
Data GHI recorded once per second using LICOR Li-200SZ silicon pyranometers. 4
Model Development • Decompose GHI timeseries into variability at different time scales using the top hat wavelet • Determine correlation of GHI fluctuations as a function of distance and timescale between different sites • Use correlation relationship to model variability for a variety of solar PV plant types: distributed/central, large/small • Setup a simple user interface: draw polygons around PV on Google map; input point sensor time series; output DC power for PV plant. 6
Top Hat Wavelet Transform • Wavelet decomposition using a “top hat” wavelet • Shows fluctuations away from mean at each timescale • Strong peaks (high variability) of duration 2048 sec (~34min) are detected at 10:30 and 11:00. • Clear sky: No fluctuations from 12:00 to 15:30.
Correlation Between Sites • Correlation at each timescale found by comparing the wavelet modes for two sites at a certain timescale • Normalized distance divided by time scale (Hoff, 2011*) Large distance or small time Small distance or large time 8 *presentation by Tom Hoff at DOE/CPUC High Penetration Solar Forum, March 2, 2011
Case Study Compare variability of PV plants: UCSD 1.2 MW Distributed PV UCSD 1.2 MW Central PV Henderson, NV 48 MW Central PV
Correlation -> Variability Ratio (VR) • VR can be computed between each set of points (“containers”) for an entire plant over all timescales • After a wavelet transform, each wavelet mode from a point sensor is divided by the VR at that timescale to create wavelet modes for the PV plant. An inverse transform creates the PV plant output. 10
1.2 MW UC San Diego PV plant UCSD distributed PV plant central PV plant of same MW size
48MW Henderson, NV PV plant Henderson, NV Central PV UCSD Distributed PV UCSD: 1.2 MW; 0.4 kW containers Henderson: 48 MW; 90 kW containers
PV plant variability expressed in GHI units • Power output smoothed compared to point sensor • UCSD distributed has noticeably smaller fluctuations than UCSD central. 13
Acknowledgements • We very much appreciate funding from the DOE High PV Penetration Program • Questions? • Please come visit us at solar.ucsd.edu • Contact: mlave@ucsd.edu 14
Model Assumptions • Correlations are solely a function of distance and timescale: no consideration for anisotropic variations • PV is spaced evenly throughout the plant area • “Containers” of varying size are appropriate to model PV plants • PV plant average GHI can be converted into plant power output 16
Power Content of Fluctuations • Power content = integral of wavelet mode at a certain timescale – shows variance at each timescale • Power content of one highly variable day (left) is much larger than the average power content of 48 days • Power content of average of 6 sites always less than power content of EBU2 17
Variability Ratio to allow for easy visual comparison on same plot 1 vs. 48 days various N VR is a function of timescale and number of sites (or, rather, correlation between sites) 18
Future Improvements • Compare correlations found at UC San Diego to other locations • Verify correlation relation at very short distances • Compute power output with PV performance model • Validate against actual power plant data 19