Equatorial Ocean Circulation and Climate Patterns
420 likes | 520 Vues
Explore the dynamics of ocean currents, air-sea interactions, and climate impacts in the equatorial region with a focus on El Niño and La Niña events. Discover how trade winds, upwelling, and temperature gradients influence sea surface temperatures and weather patterns across the West and East Pacific. Dive into the Walker Circulation and its role in shaping rainfall distribution, with insights into the impacts of El Niño and La Niña on global climate.

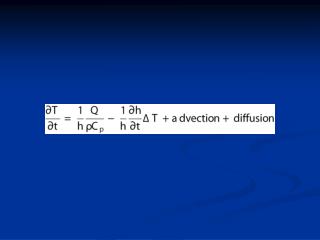
Equatorial Ocean Circulation and Climate Patterns
E N D
Presentation Transcript
West East EQ Equatorial Divergence
2˚N EQ Trade Winds 2˚S West East Equatorial Divergence map view Ekman Transport {to right in NH} DIVERGENCE Ekman Transport {to left in SH}
Trade Winds X X X 2˚S 2˚N Ekman Trans. Ekman Trans. {to left in SH} {to right in NH} Equatorial Divergence cross-section
Trade Winds X X X 2˚S 2˚N Ekman Trans. Ekman Trans. {to left in SH} {to right in NH} Equatorial Divergence cross-section DIVERGENCE UPWELLING
Warm Surface Layer Cold Deep Ocean West East Equatorial upwelling - E vs. W Easterly Trade Winds
Thick Warm Surface Layer Warm Surface Layer Thin Warm Surface Layer Thermocline Cold Deep Ocean West East Equatorial upwelling - E vs. W Easterly Trade Winds
Upwell Warm Water in West Upwell Cold Water in East Thick Warm Surface Layer Warm Surface Layer Thin Warm Surface Layer Bottom of Ekman Layer Thermocline Cold Deep Ocean West East Equatorial upwelling - E vs. W Easterly Trade Winds
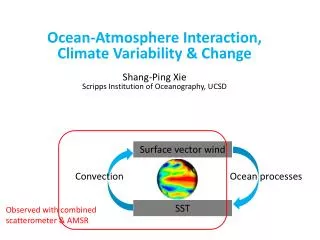
Cold Deep Ocean West East Air-Sea Feedbacks Easterly Trade Winds L H Upwelling Due to Winds
Cold Deep Ocean West East Air-Sea Feedbacks Trade Winds Enhanced by Pressure Gradient Easterly Trade Winds L H colder Upwelling Due to Winds Upwelling Enhanced by Winds
Cold Deep Ocean West East Air-Sea Feedbacks Trade Winds Enhanced more by stronger Pressure Gradient Trade Winds Enhanced by Pressure Gradient Easterly Trade Winds Stronger H L colder Upwelling Due to Winds Upwelling Enhanced by Winds Upwelling Enhanced even more by Winds
West East Air-Sea Feedbacks Walker Cell Or Walker Circulation L H
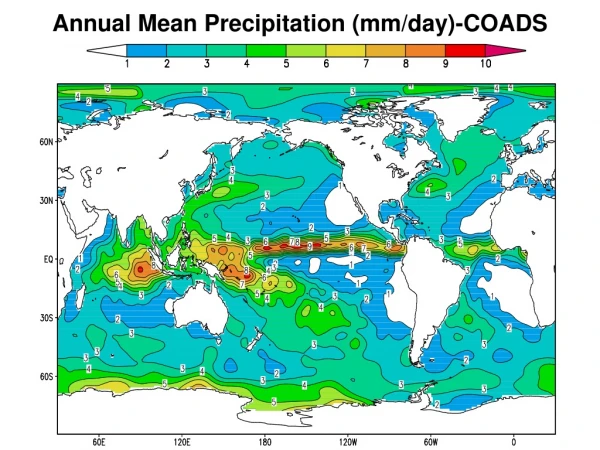
Cold sinking air Warm rising air A big result of Different “Pressure” zones: moisture. WIND As air rises, it cools, water condenses, lots of rain As air sinks, it warms, lots of evaporation WIND LOW Pressure HIGH Pressure W E
“Normal” conditions • Walker Circulation Strong • Trades blow E to W • Thermocline shallow in E • Upwelling of cold water in E • Warm water piles up in W • E to W temperature gradient reinforces trades
What is an El Niño? Walker Circulation Gone, reverse flow West East
El Niño conditions • Walker Circulation Weak or Gone • Trades very weak or reversed • Thermocline deep in E • Upwelling of warm water in E • Sea level rises in E • E to W temperature gradient reduced or gone
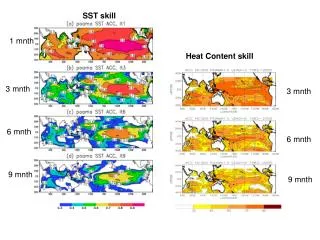
“Normal” “El Niño” www.pmel.noaa.gov/tao/elnino
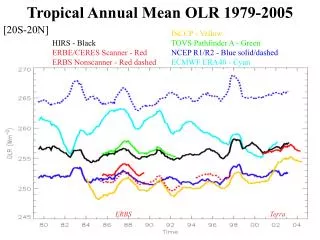
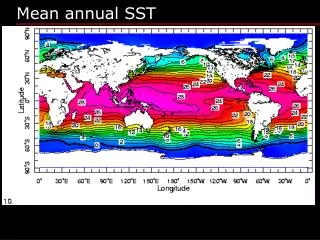
Annual Average “Normal” Short-lived deviation from “Normal”: El Niño (March 1998)
La Niña conditions • Walker Circulation Stronger than normal
Normal conditions El Niño conditions
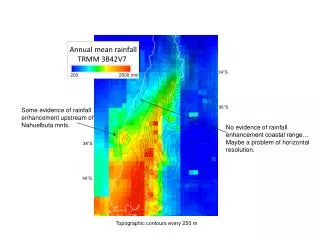
West East Normal rainfall Walker Cell Or Walker Circulation Lots of Rain L H Very Dry
West East El Niño rainfall Walker Circulation Gone, reverse flow Dry (fires in Australia) Wet (floods in Peru)