SlideServe
Menu
Préférences
© SlideServe · v2026
Michael M Shearer

Michael M Shearer

@shearer
United States

10 Contenus publiés

23 Object-Oriented Testing PPT
Object-Oriented Testing

Object-Oriented Testing. CIS 375 Bruce R. Maxim UM-Dearborn. OO testing Activities. Review OOA and OOD models Class testing after code is written Integration testing within subsystems Integration testing as subsystems are added to the system Validation testing based on OOA use-cases.

312 vues
27 cells: The living units PPT
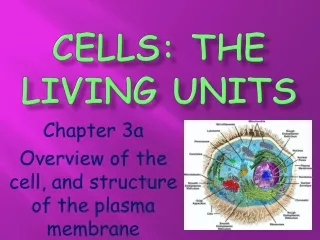
cells: The living units

cells: The living units. Chapter 3a Overview of the cell, and structure of the plasma membrane. http://www.youtube.com/watch?v=gFuEo2ccTPA. Cells. The cell is the basic structural and functional unit of life Amoebas are single-cellular

296 vues
73 FAIR LABOR STANDARDS ACT PPT
FAIR LABOR STANDARDS ACT

FAIR LABOR STANDARDS ACT. Major Provisions. Youth Employment. Coverage. Minimum Wage. Recordkeeping. Overtime. Employment Relationship. In order for the FLSA to apply, there must be an employment relationship between the “employer” and the “employee”.

771 vues
18 Quebec’s Independence Movement PPTX
Quebec’s Independence Movement

Quebec’s Independence Movement. Province of Quebec. Quebec is located in eastern Canada. A large part of Canadian industry is centered in Quebec. Many electronics and computer factories are based here. French is the official language of business and government in Quebec.

219 vues
23 The Rise of a Mass Democracy 1824–1840 PPTX
The Rise of a Mass Democracy 1824–1840

The Rise of a Mass Democracy 1824–1840. Images for AP Sources. Forging the New Economy 1790-1860. Images for AP Sources. The Ferment of Reform and Culture 1790-1860. Images for AP Sources.

247 vues
10 Section 2.3 – Graph Equations of Lines PPT
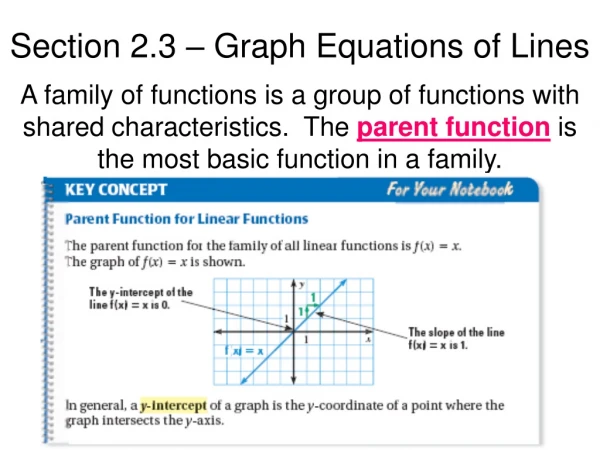
Section 2.3 – Graph Equations of Lines

Section 2.3 – Graph Equations of Lines. A family of functions is a group of functions with shared characteristics. The parent function is the most basic function in a family. Section 2.3 – Graph Equations of Lines. Example 1: Graph the equation. Compare the graph with the graph of y = x.

154 vues