Download
1 / 41
410 likes | 622 Vues
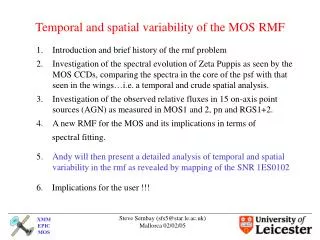
Temporal and spatial variability of the MOS RMF. Introduction and brief history of the rmf problem Investigation of the spectral evolution of Zeta Puppis as seen by the MOS CCDs, comparing the spectra in the core of the psf with that seen in the wings…i.e. a temporal and crude spatial analysis.

E N D
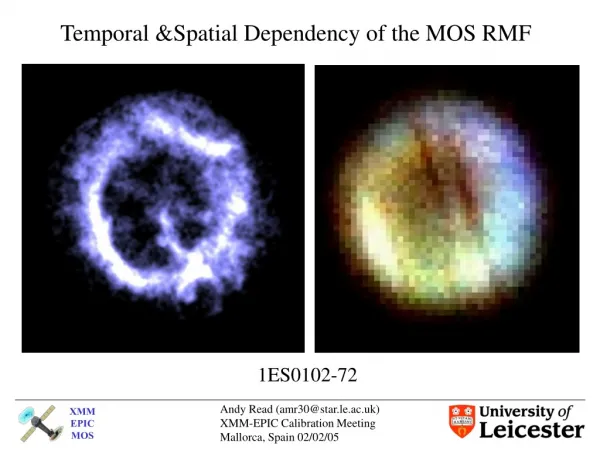
Temporal and spatial variability of the MOS RMF Introduction and brief history of the rmf problem Investigation of the spectral evolution of Zeta Puppis as seen by the MOS CCDs, comparing the spectra in the core of the psf with that seen in the wings…i.e. a temporal and crude spatial analysis. Investigation of the observed relative fluxes in 15 on-axis point sources (AGN) as measured in MOS1 and 2, pn and RGS1+2. A new RMF for the MOS and its implications in terms of spectral fitting. 5. Andy will then present a detailed analysis of temporal and spatial variability in the rmf as revealed by mapping of the SNR 1ES0102 6. Implications for the user !!!
The low energy redistribution function of the MOS CCDs has a complex shape. Measurements from the Orsay Synchrotron of MOS1/CCD1 The main photopeak has a secondary component (shoulder) which relatively increases with descreasing energy until it is the dominant component. E1+E2
Surface electrode structure of a type 22 EEV MOS CCD. The etched areas of the open phase in a single pixel are marked in red. Difference in redistribution shape of mono and bi-pixels indicate charge loss shoulder in mono pixels is much stronger
Surface electrode structure of a type 22 EEV MOS CCD. Difference in redistribution shape of mono and bi-pixels indicate charge loss shoulder in mono pixels is much stronger
Intrinsic change in redistribution properties of the central CCDs: Open filter observations of the INS RX J0720 Shift in spectrum to lower energies Effect most pronounced at lower energies
Evolution of the redistribution function in current SAS Smaller change at higher energies: Integrated photopeak at 550 eV down by ~ 4% Significant change at low energies
Zeta Puppis: Early O-type Supergiant Distance 429 pc, mv=2.25 Observation from Rev 156 Useful for checking CCD rmf especially around ~400-450 eV due to strong N lines Poor fit in wings of rmf due limitations of mathematical model and intrinsic spectral uncertainties
Five Observations of Zeta Puppis analysed to date: • On Axis: Rev 156, 542, 636 and 795 • Off Axis: Rev 903 (RGS Test) All Large Window and Thick Filter in both MOS Cameras
Here are four off them…….. MOS1 156 542 156 903 636
MOS2 156 542 903 636
MOS1 ON-AXIS 542,636,795 ON-AXIS 156 OFF-AXIS 903
Investigate epoch and spatial dependant variations in the core and wings spectra in 3 Energy bands 100-650 eV 350-650 eV 100-300 eV
Comparison of high energy portion of the spectra from 795 and 903 Count Rate/Effective Area normalised to Rev 156 Datum Rate down 8% Eff. Area down 3% Flux down 5%
Comparison study (MOS v pn v RGS) of 15 on-axis point sources: all AGN, all similar soft/excess or steep spectrum with columns ~few 1020 cm-2 Methodology: 1) Use a conservative 15-40 arcsec radius extraction annulus for all EPIC targets to minimise pile-up. 2) Calculate fluxes in selected energy bands using an absorbed power-law model. 3) Compare flux ratios as function of epoch.
pn/M2=1.14 pn/M2=1.06
pn/M2=1.06 pn/M2=1.04
Drop in area under main Photopeak at 550 eV = 4%
Consequence for continuum fitting…..I Flux 0.4-0.8 keV x10-11 ergs cm-2s-1 pn (new): 1.02 (0.05) M1 (new): 0.90 (0.10) M1 (old): 0.86 (0.10)
Possibilities….. Change the boresight….ok for point sources but doesn’t help extended sources. 2. Define set of fixed rmfs for particular spatial regions and average the rmfs for a given extraction region. Come up with a correction scheme on a per-pixel (or event basis) so that the spatial (and temporal) dependancy is accounted for at the event processing level.