Download
1 / 25
250 likes | 282 Vues
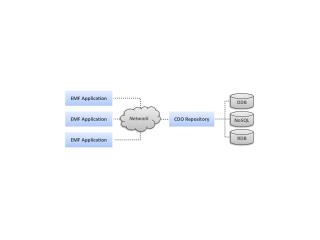
Collateral Debt Obligations (CDO) Collateral Loan Obligations (CLO). A Quick Overview. Review of the CDO/CLO Asset Class Portfolio. Investment Management. Portfolio of Investments. Leverage Loan Fund. Investments: (Leveraged Loans / HY Bonds). Investment Management.

E N D
Collateral Debt Obligations (CDO) Collateral Loan Obligations (CLO) A Quick Overview
Review of the CDO/CLO Asset Class Portfolio Investment Management Portfolio of Investments Leverage Loan Fund Investments: (Leveraged Loans / HY Bonds)
Investment Management Leverage Bond / Loan Fund (Special Purpose Company) Equity: $50,000,000 5 x Leverage Factor 1 Debt (Loan): $250,000,000 @ Libor Rate + 0.75% or ($1,875,000) Total Fund:$300,000,000 Portfolio of Investments $300M Investments: (Leveraged Loans/Bonds) 1
Portfolio of Investments (Loans / Bonds) Investment Management Leverage Loan / Bond Fund Equity: $50,000,000 5 x Leverage Factor Debt (Loan/Bond): $250,000,000 @ Libor Rate + 0.75% or ($1,875,000) Total Fund:$300,000,000 $300 million $2 m $3 m $5 m $4 m $6 m $5 m $2 m $4 m $4 m
Portfolio of Investments (Loans/Bonds) Investment Management Leverage Loan/Bond Fund Equity: $50,000,000 Debt (Loan): $250,000,000 @ Libor Rate + 0.75% or ($1,875,000) $300 million $300 million Average LIBOR + 2.8% $8,400,000 $2 m $3 m $5 m $4 m $6 m $5 m $2 m $4 m $4 m
Investment Management Leverage Loan/Bond Fund Equity: $50,000,000 Debt (Loan): $250,000,000 @ Libor Rate + 0.75% or ($1,875,000) Portfolio of Investments (Loans/Bonds) $300 million $300 million Average LIBOR + 2.8% $8,400,000 0.75% Management Fee $1,875,000 $2 m $3 m $5 m Gross Income $8,400,000 Less: Mgmt Fee $2,250,000 Loan $1,875,000 Net Income $4,275,000 $4,275,000 /$50,000,000 = 8.50% Net 1 $4 m $6 m $5 m $2 m $4 m $4 m 1 At a higher leverage-ratio-fund the returns will be more than doubled due to half the Equity required despite the higher cost and higher amount of debt.
Investment Management Leverage Loan/Bond Fund Portfolio of Investments Investments: (Leveraged Loans / HY Bonds)
Executive Summary Fund Overview • Leverage Loan Fund Invests in the senior bank loan asset class which has: • Considerable attraction at this point in the economic and interest rate cycle • Unique recovery characteristics • No interest rate risk due to floating rate characteristics • Low correlation to other asset classes • Low price volatility
Name: Portfolio Management Company Issuer: Fund Incorporated f Objective: High c urrent income with preservation of capital Minimum Fund Size: USD $25 million Target Fund Size: USD $50 million. Investment Advisor: Advisor Redemptions: Monthly, subject to a 2% redemption fee in year 1 Cash Dividends: Paid quarterly Minimum Subscription: USD $1 Million Subscriptions: Monthly Management Fee: 0 .75% per annum on assets ( based on reference portfolio size) Administrative Fees: 30 basis points per annum (estimated) Executive Summary Fund Summary Term Sheet
Cypress Tree Investment Management Cypress Tree Leverage Alternative Fund (CLAIF) Cypress Tree Portfolio of Investments Investments: (Leveraged Loans)
Portfolio Selection & Monitoring Portfolio Selection Criteria • Reference Portfolio will be managed to maintain or exceed standards consistent with prudent portfolio management theory: • Weighted average rating factor (WARF) less than 2000 (equivalent to the Ba3/B1 midpoint on an inverse scale) • Issuer concentration not to exceed 3% of the aggregate portfolio (post ramp-up) • Industry concentration not to exceed 10% of the aggregate portfolio (post ramp-up) • Real estate loans will not be permitted • Portfolio will be marked to market weekly • Companies subject to more scrutiny: • Significant exposure to single or multiple highly correlated commodities • Lack of tangible assets • Loans priced below 95 / Bonds priced below 80 • Dependency on asset sales or refinancing for repayment • Exposure to highly cyclical industries • Significant government regulation
The Fund Expected Portfolio Statistics • Total Loan Portfolio: $250 Million • Average Holding: 1.3% • Average Spread Loan: LIBOR + 325 bps. • Average Fixed Yield: 8.0% • Weighted Average Rating: Ba3/B1 • #of Industries: 20-25 • #of Issuers: 60-75 • Average Maturity: 5 Years • Maximum Industry Concentration 10% • Maximum Issuer Concentration 3%
CHEMICALS AEROSPACE UTILITY 5% 3% 4% CONSUMER DURABLES TRANSPORTATION 1% 7% CONSUMER NON-DURABLES 6% SERVICE RETAIL ENERGY 6% 2% 2% FINANCIAL 1% FOOD AND DRUG METALS/MINERALS 2% 2% FOOD/TOBACCO 7% FOREST PROD/CONTAINERS 4% GAMING/LEISURE MEDIA/TELECOM 5% 24% HEALTHCARE 8% HOUSING 3% MANUFACTURING INFORMATION 5% TECHNOLOGY 3% Portfolio Selection & Monitoring U.S. Loan Market Distribution by Industry By Amount By Issuer
Investment Management Leverage Loan/Bond Fund Portfolio of Investments Investments: (Leveraged Loans / HY Bonds) Company
Typical Leveraged Company & Transaction • Typical Leveraged Company • Average Revenues of $1 Billion • Total Assets of $1 Billion • BB- rated by Standard and Poors • #1 or #2 in its industry (market share) • Private Company ( Sometimes Public) • Equity Sponsor involved • Typical Leveraged Transaction • $500 million Bank Debt (Leveraged Loan) • $300 million Corporate High Yield Bonds • $200 million Equity • Loan is secured by all the assets and the stock of the Company • Bank Debt / EBITDA = 3.0x • Total Debt / EBITDA = 5.0x
The Case for Loans Why Invest in Floating Rate Loans? Over a 12-year period, leveraged loans have outperformed all other asset classes on a risk/return basis. Some of the reasons are: • Insulation from Interest Rate Risk – Interest rates are currently at 40-year lows. Because each loan’s rate of interest is reset at least every 90 days, loan rates rise with market rates and inflation. • Low Price Volatility - Reduced volatility results from a low correlation/covariance with other assets. The floating rate nature of leveraged loans contributes to its low correlation with other security types. Only short-term Treasury Bills, consistently exhibit lower volatility. • Defensive Strategy – Senior loan funds have historically provided consistent, higher risk-adjusted returns compared to other asset classes which may be attractive for investors during volatile markets. Given the current low rate climate, floating rate loan funds offer significant downside protection, especially with a weaker dollar and a potentially strengthening economy. Rising rates usually imply a stronger economy which in turn reduces the risk of default.
The Case for Loans Why Invest in Floating Rate Loans? • Increased Efficiency – Leveraged loans are highly efficient portfolio assets with the highest Sharpe ratio and return per unit of risk of any major asset class. Adding loans to any portfolio offers the investor the opportunity for meaningful portfolio diversification due to their extremely low correlation with the performance of other major asset classes. • Lower Loss Characteristics – Loans represent the senior claim in a borrower’s capital structure and usually are secured by the bulk of the borrower’s assets. Because of this seniority protection, loans are the last to be impacted by any weakening in the financial condition of the borrower. • Liquidity in the Secondary Market – The size of the leveraged loan market has grown substantially over the last 9 years. At the end of 2003 the size of the leveraged loan market totaled approximately $1 trillion versus only $150 billion at the end of 1993. All of this growth has contributed to greater liquidity and better pricing in the secondary market.
The Case for Loans Timing is Right for Leveraged Loans • Peak of the default cycle has passed • New transactions are more conservatively structured and remain attractively priced for the risk • Interest rates are likely to increase from this point in the economic cycle • Supply of new issues expected to grow in 2010 • Projected returns represent excellent value on both a relative and absolute basis
The Case for Loans Rates of Recovery on Defaulted Assets* Asset Type 1988-2003** 1998-2003*** * Excluding Telecom ** 2079 Observation *** 897 Observation • Bank Loans have very high recovery rates relative to Notes Source: S&P
12.00% S&P 500 10.00% CSFB HY Index U.S. LT Gvt ML Corp 8.00% CSFB Leveraged Loan Index Annualized Return U.S. IT Gvt 6.00% U.S. 30 Day TBill 4.00% 195 bp Outperformance U.S. Inflation 2.00% Gold 0.00% 0.00% 2.00% 4.00% 6.00% 8.00% 10.00% 12.00% 14.00% 16.00% 18.00% Annualized Return Volatility The Case for Loans Return/Risk Profile 1992-2010 Source: CSFB
JPM Emerging Markets CSFB High Yield Index U.S. 30 Day TBill TR U.S. Inflation U.S. IT Gvt ML Corp S&P 500 Gold 1992-2010 U.S. IT Gvt 0.11 ML Corp 0.07 0.86 S&P 500 0.08 -0.06 0.16 JPM Emerging Markets -0.01 0.26 0.46 0.52 Gold -0.22 0.06 0.11 -0.07 0.24 U.S. Inflation 0.11 0.03 0.00 -0.08 -0.01 0.02 CSFB High Yield Index -0.14 -0.02 0.36 0.50 0.52 0.06 -0.02 CSFB Leveraged Loan Index -0.03 -0.16 0.07 0.14 0.05 0.03 -0.09 0.49 The Case for Loans Correlation of Various Asset Classes 1992-2010 • Loans have low correlation to other asset classes Source: CSFB Correlation based on the 1992-2003 market data
The Case for Loans Summary Statistics of Various Asset Classes 1992-2010
Investment Management Leverage Loan / Bond Fund Portfolio of Investments Investments: (Leveraged Loans / HY Bonds)
Overview Company Overview • Specialization / Expertise in the inefficient markets of leveraged loans, high yield bonds, and distressed securities • Successful track record managing over a cumulative total of approximately through various market and economic cycles • Portfolio managers experience of loan/high yield management experience • Low default experience • Proven investment strategy • Institutional credit culture with proactive infrastructure