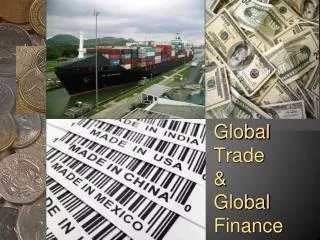
CHAPTER-1 GLOBAL FINANCE
CHAPTER-1 GLOBAL FINANCE. PRIMARY GOAL OF A FIRM. Risk Reduce. Maximize Firm Value (Stock Price). Increase Profit. FUNCTIONS OF FINANCIAL MANAGEMEN TO MAXIMIZE STOCK PRICE. Financial Planning and Control: Supportive Tools and Reporting & Controlling Financing 3. Investment.

CHAPTER-1 GLOBAL FINANCE
E N D
Presentation Transcript
CHAPTER-1 GLOBAL FINANCE
PRIMARY GOAL OF A FIRM Risk Reduce Maximize Firm Value (Stock Price) Increase Profit
FUNCTIONS OF FINANCIAL MANAGEMEN TO MAXIMIZE STOCK PRICE • Financial Planning and Control: Supportive Tools and Reporting & Controlling • Financing • 3.Investment Supportive Tools (Chs. 1-10) Financing (Chs. 11-14) Investment (Chs. 15-19) Reporting & Controlling (Chs. 20)
MAJOR INTERNATIONAL TRANSACTION 1. Foreign Investment: direct and portfolio 2. Foreign Trade: exports and imports 3. Foreign Loan
REASONS TO STUDY INTERNATIONAL FINANCE 1.To understand a global economy in terms of: a. The end of cold war b. Industrialization and growth of the developing world c. Increased globalization. 2.To understand the effect of global finance on business 3.To make intelligent personal decisions
COMPANY GOALS AND FUNCTIONS OF FINANCIAL MANAGEMENT 1. To maximize stockholder wealth (stock price) on a global basis. 2. Functions of international financial manager: a. Financial planning and control b. Allocation of funds (investment) c. Acquisition of funds (financing)
MULTINATIONALCOMPANIES AND THEIR PERFORMANCE MNCs have performed better than domestic performs due to: a. Higher risk-return tradeoff b. Market imperfections c. Portfolio effect d. Comparative advantage e. Internationalization advantages f. Larger economies of scale g. Larger valuation.
AGENCY THEORY • MNC's value is subject to larger agency cost. • Agency theory is a theory that deals with the conflict of interest between managers and stockholders. a. Incentives b. Monitoring c. Agency costs d. Agency costs are then compared
CORPORATE GOVERNANCE 1. Shareholder activism 2. Recent changes in the US corporate governance 3. US corporate governance
CHAPTER 2 MOTIVES FOR WORLD TRADE AND FOREIGN INVESTMENT
MOTIVES FOR WORLD TRADE AND FOREIGN INVESTMENT INVESTMENT THEORIES TRADE THEORIES u. Comparative Advantage v. Factor Endowment w. Product Life Cycle x. Product Life Cycle y. Portfolio Theory z. Oligopoly Eclectic Theory
TRADE THEORIES • Countries gain from trade by producing products they have a comparative advantage. • Countries gain from specializing in the production and export of any good that uses larger amounts of their own abundant factors. • Explain trade patterns on the basis of stages in a product's life.
INVESTMENT THEORIES • Explain changes in the location of production on the basis of states in a product's life. • Improve its risk-return performance by holding an internationally diversified portfolio of assets. • Invest abroad to exploit their quasi-monopoly advantages.
ECLECTIC THEORY • Exploit foreign markets through exports first and then invest abroad at some point in the future. • Location specific advantages, such as natural resources and low labor cost. • Ownership specific advantages, such as capital funds and technology. • Internationalization advantages are location and ownership advantages magnified by international investment.
BENEFITS OF OPEN TRADE • Allocation efficiency is obtained because MNCs devote more of their resources to producing those products with a comparative advantage. • Increased competition stimulates efficiency and growth. • Production efficiency is obtained because foreign trade stimulates the flow of new ideas and information across borders. • Expanded menu of goods.
PROTECTIONISM • Reasons for protectionism include national security, unfair competition, infant industry argument, domestic employment, and diversification. • Forms of protectionism are tariffs, quotas, and other trade barriers.
ECONOMIC INTEGRATION World Trade Organization (WTO) replaced GATT on January 1, 1995. a. Most favored nation clause: if a country grants a tariff reduction to one country, it must grant the same concession to all other WTO countries. b. To join the WTO, countries must adhere to the most favored nation clause.
ECONOMIC INTEGRATION Trading blocs: Types of economic cooperation a. Free trade area: no internal tariffs. b. Customs union: no internal tariffs and common external tariffs. c. Common market: customs-union features + free flow of production factors. d. Economic union: common-market features with harmonization of economic policy. e. Political union: economic-union features with political harmony
ECONOMIC INTEGRATION Regional economic agreements: • North American Free Trade Agreement of the US, Canada, and Mexico on January 1, 1994. • European Union of 15 countries began its operations with a single Central European Bank on January 1, 1999. The EU accepted 10 new members on Mary 1, 2004. • Asian integration efforts consist of the Association of South East Asian Nations (ASEAN), The Asian Pacific Economic Cooperation (APEC), and informal yen-trading bloc.
CHAPTER 3 THE BALANCE OF PAYMENTS
ACCOUNTING TREATMENT • A country's balance of payments is the record of transactions between its residents and foreign residents over a specified period. • The balance of payments is a sources-and-uses-of-funds statement. • Transactions that earn foreign exchange are recorded as credit, plus, or cash inflows (sources), such as exports of goods and services. • Transactions that expend foreign exchange are recorded as debit, minus, and cash outflows (uses), such as imports of goods and services.
Numerical Example Debits (Outflows) Credits (Inflows) Example Expend Foreign Exchange Earn Foreign Exchange 3-1a $30,000 3-1b $ 5,000 3-1c 20,000 3-1d 5,000 3-1e 10,000 Reserves 10,000 Total $40,000 $40,000
DEFICIT OR SURPLUS 1. Autonomous transactions are those that occur because of self-interests, while compensating transactions are those that occur to eliminate the balance-of-payment imbalance. 2. Surplus: autonomous receipts > autonomous payments. 3. Deficit: autonomous receipts < autonomous payments. 4. Balance of payments is used to: a. predict pressures on foreign exchange rate. b. anticipate government policy actions. c. assess a country's credit and political risks. d. evaluate a country's economic health.
BALANCE OF PAYMENTS ACCOUNTS Current Account: Group A, Consists of: a. Goods b. Services c. Income d. Current transfers.
BALANCE OF PAYMENTS ACCOUNTS Capital Account: Group B, Consists of: a. Capital transfers b. Acquisition or disposal of nonproduced, nonfinancial assets.
BALANCE OF PAYMENTS ACCOUNTS Financial Account: Group C, Consists of : a Foreign direct investment b Foreign portfolio investment c Other investments.
BALANCE OF PAYMENTS ACCOUNTS Net Errors and Omissions: Group D This is a plug item designed to keep the balance-of-payments accounts in balance. Reserves and Related Items: Group E, Consists of: a Official reserve assets b Use of IMF credits and loans c Exceptional financing.
BALANCE OF PAYMENTS ACCOUNTS Balance of payment identity: a. Flows of goods and services: current account. Flows of financial assets (net foreign investment) = capital account + financial account + net errors and omissions + reserves and related items. b. Flows of goods and services + net foreign investment = 0 or current account + capital account + financial account + net errors and omissions + reserves and related items = 0
THE ACTUAL BALANCE OF PAYMENTS Major Countries on Current Account a The US incurred massive current-account deficits during the 1990s and early 2000s. b Japan incurred massive current-account surpluses during the 1990s and early 2000s.
THE ACTUAL BALANCE OF PAYMENTS Major Country Balances in Financial Account a. The US incurred massive financial- account surpluses during the 1990s and early 2000s. b. Japan incurred massive financial- account deficits during the 1990s and early 2000s.
THE ACTUAL BALANCE OF PAYMENTS The World Balance of Payments a. The expansion of world trade grew 6.4 percent per year between 1991 and 1999, 13.1 percent in 2000, 0.4 percent in 2001, and 3.0 percent in 2002, but it expected to grow by about 7 percent per year from 2003 to 2005. b. The expansion of world output grew 2.4 percent per year between 1991 and 1999, 3.8 percent in 2000, 1.2 percent in 2001, and 1.7 percent in 2002, but it expected to grow between 2 and 3 percent per year between 2003 and 2005. c. Those statistics in a and b indicate the relative openness of markets and the ongoing integration of the global economy.
INTERNATIONAL INVESTMENT POSITION 1. International investment position is a stock concept because it summarizes a country’s assets and liabilities on a given date. 2. The US is the largest net debtor nation in the world, while Japan is the largest net creditor nation in the world. 3. Foreign direct investment (FDI) in the US accounts for 35 percent of foreign assets in the US, but FDI in Japan accounts for 10 percent in foreign assets in Japan. 4. The US’s other investment (mostly short-term capital flows) accounts for 30 percent of its total foreign assets, while Japan’s other investment amounts to more than 45 percent.
HOW TO REDUCE A TRADE DEFICIT 1. Deflate the economy through tight monetary and fiscal policies. 2. Devalue the currency. 3. Establish public control. 4. J-Curve a. J-curve is a theory designed to explain why a currency depreciation may not improve the balance of trade. b. The J-curve effect holds that a country's currency depreciation causes its trade balance to deteriorate for a short time, followed by a flattering out period, and then a significant improvement occurs for an extended period.
CHAPTER 4 THE INTERNATIONAL MONETARY SYSTEM
FLEXIBLE EXCHANGE RATE 1. Flexible exchange rates are exchange rates, which fluctuate according to market forces. 2. Advantages: a. Allow countries to maintain independent economic policies. b. Permit a smooth adjustment to external shocks. c. Don't need to maintain large international reserves. 3. Disadvantages: a. Flexible exchange rates are highly unstable so that flows of foreign trade and investment may be discouraged. b. They are inherently inflationary.
FIXED EXCHANGE RATES 1. Fixed exchange rates are exchange rates which do not fluctuate or which change within a predetermine band. 2. Fixed exchange rates provide the stability of exchange rate, but their disadvantages include: a . Too rigid to take care of major upheavals. b. Need large reserves to defend the fixed exchange rate. c . May cause destabilizing speculations; most currency crises took place under a fixed exchange system. 3. Currency board is a monetary institution that only issues currency to the extent if it is fully backed by foreign reserves; this system is a rather rigid form of fixed exchange rates.
MARKET EQUILIBRIUM 1. The equilibrium exchange rate and quantity are determined at the point where the demand curve for and the supply curve of foreign exchange are intersected.
MARKET EQUILIBRIUM 2. Assuming that the US dollar is a domestic currency and the British pound is a foreign currency, the demand curve for a foreign currency could be shifted to the right because of: a. A higher inflation rate in the US b. Lower interest rates in the US c. An increase in the US income level d. US government purchase of British pounds.
MARKET EQUILIBRIUM 3. The supply curve for a foreign currency could be shifted to the right because of: a. A higher inflation in Britain b. Lower interest rates in Britain c. An increase in the British income level d. British government sale of US dollars.
HISTORY OF INTERNATIONAL MONETARY SYSTEM 1914 Breakdown of gold standard and monetary disorder began. 1934 US dollar pegged at $35 per ounce of gold. 1944 Conference of Bretton Woods, New Hampshire established a fixed exchange system based on the US dollar. IMF and World Bank created. 1958 European Economic Community established.
HISTORY OF INTERNATIONAL MONETARY SYSTEM 1963 The US levied "Interest Equalization Tax" on foreign borrowings in US capital markets. 1963 The US imposed voluntary controls on capital outflows from US banks and companies. 1968 The US imposed mandatory controls on foreign investment by US companies. 1970 Special drawing rights (SDRs) created.
HISTORY OF INTERNATIONAL MONETARY SYSTEM 1971 On August 15, the US dollar floated; the convertibility of the US dollar eliminated; an import surcharge imposed. On December 17, Smithsonian Agreement reached; the US dollar devalued from $35 per ounce of gold to $38. 1972 A snake (2.25%) within a tunnel (4.5%) established. 1973 The US dollar devalued from $38 to $42.22 in March. 1973 Organization for Petroleum Exporting Countries (OPEC) imposed oil embargo, eventually quadrupling world prices of oil.
HISTORY OF INTERNATIONAL MONETARY SYSTEM 1976 IMF meeting in Jamaica, known as "Jamaica Agreement," legalized the existing floating system. 1978 The EEC established the European Monetary System which officially replaced a snake within a tunnel. This is a joint floating system. 1982 Latin American debt crisis began. 1985 Group of Five countries reached "Plaza Agreement" to reduce the value of the US dollar.
HISTORY OF INTERNATIONAL MONETARY SYSTEM 1987 Major industrialized countries reached "Louvre Accord" to support stability and exchange rates around their current levels. 1992 High German interest rates caused "the September 1992 currency crisis in Europe." Italy and the United Kingdom withdrew from the European Monetary System. 1993 The July 1993 currency crisis in Europe forced the EEC to widen allowable deviation band to +15 percent. 1993 A Single European Community created. The name of the EEC has changed to the European Union (EU).
HISTORY OF INTERNATIONAL MONETARY SYSTEM 1994 Mexican peso suffered major devaluation (40%) and began to float. 1997 In July 1997, currency turmoil erupted in Thailand and spread to Indonesia, South Korea, and other South Asian countries. 1999 On January 1, 1999, 11 European countries launched a single European currency called the euro, with a common monetary policy established by an independent European Central Bank.
HISTORY OF INTERNATIONAL MONETARY SYSTEM 2002 On January 1, the euro began public circulation and traded alongside the national currencies. On July 1, the euro replaced the national currencies of euro-zone countries. 2004 On May 1, the EU accepted 10 new members: Cyprus, the Czech Republic, Estonia, Hungary, Latvia, Lithuania, Malta, Poland, Slovakia, and Slovenia.
INTERNATIONAL MONETARY FUND Created in 1944, its objectives are: a. To promote international monetary cooperation. b. To facilitate the balanced growth of world trade. c. To promote exchange stability. d. To eliminate exchange restrictions. e. To create standby reserves.
SPECIAL DRAWING RIGHTS (SDRs) SPECIAL DRAWING RIGHTS (SDRs) 1. IMF created SDRs in 1969. 2. 1970-1974: SDR's value tied with the US dollar. 3. 1974-1981: SDR's value tied with a basket of 16 currencies. 4. Since 1999, SDR's value tied with the US dollar, Japanese yen, British pound, and euro. 5. IMF use SDRs in a variety of transactions and operations. In addition, SDRs are used as means to determine a reference interest rate, an international reserve asset, and a unit of account.
NEW INTERNATIONAL MONETARY SYSTEM 1. Exchange rates are said to be "volatile" if their fluctuations are wide and unpredictable. The world has experienced more volatile exchange rates since the Bretton Wood System collapsed in 1973. 2. Many economists recommend "crawling band"--a combination of a crawling peg and a wider band as a new monetary system: a. Crawling peg is a regular modification of par value, and a wider band is used to mean a band which is wider than a 4.5% allowed under Smithsonian Agreement. 3. Advantages: this system will provide a discipline but a flexibility to accommodate divergent economies.
CHAPTER 5 FOREIGN EXCHANGE MARKET