Download
1 / 35
350 likes | 451 Vues
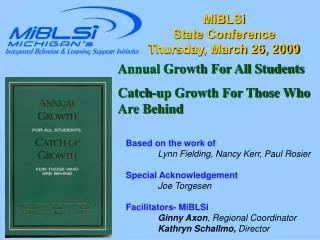
MiBLSi State Conference Thursday, March 26, 2009. Annual Growth For All Students Catch-up Growth For Those Who Are Behind. Based on the work of Lynn Fielding, Nancy Kerr, Paul Rosier Special Acknowledgement Joe Torgesen Facilitators- MiBLSi Ginny Axon , Regional Coordinator

E N D
MiBLSi State Conference Thursday, March 26, 2009 Annual Growth For All Students Catch-up Growth For Those Who Are Behind Based on the work of Lynn Fielding, Nancy Kerr, Paul Rosier Special AcknowledgementJoe Torgesen Facilitators- MiBLSi Ginny Axon, Regional Coordinator Kathryn Schallmo, Director
Setting Group Expectations • To make this breakout the best possible, we need your assistance and participation • Please allow others to listen • Please turn off cell phones and pagers • Please limit sidebar conversations • Share “air time” • Active participation • Please ask questions • Take care of your own needs • Attend to the “Come back together” signal
Agenda • Introduce the Kennewick Model • Learning Partners: Chapter 1 Annual Growth for all students, Catch-up Growth for those who are behind • Book Study Group handout www.projectspot.org
Kennewick School District Located in southeastern Washington Approximately 15,000 students in • 13 elementary schools • 4 middle schools • 3 high schools 25% of students are ethnic minorities, and 48% elementary school students qualify for free or reduced lunch
Kennewick School District Washington In 1995, the school board in Kennewick challenged the elementary schools to have 90% of their students at grade level in reading by the end of third grade –within 3 years The primary responsibility for accomplishing this was assigned to the school principals
Kennewick School District Washington David Montague Principal Washington Elementary “We thought the board and the superintendent were crazy…I saw in the White Paper that elementary principals were responsible, and said ‘Why don’t they come down to our building and see the kids that come to our school?’ I mean, our kindergarten kids seem to enter school every year with lower skills…”
The District passed a bond that provided a district reading teacher for each school, and began to hold public meetings at a different elementary school every two weeks. “After that, the whining died down. The goal started to grow legs….Principals are messengers. When you’re in the message business, it doesn’t help to criticize the message. It drives a wedge. It empowers those who don’t want to change. Since we’re responsible for implementation, it makes no sense to send a mixed message. Principals cannot play ‘loyal opposition’ harping against accountability and at the same time provide effective leadership for growth”
Kennewick School District Washington At the schools… “We began to have serious staff meetings…we began ….looking at the test data to see how far behind some of our kids were. It was the first time Washington had ever had such precise data. In the fall of 1995, 23% of our 3rd graders were reading at second grade level and 41% of our 3rd graders were reading at a kindergarten or 1st grade level.”
Washington Elementary Kennewick School District SCHOOL CHARACTERISTICS 55% Free/reduced lunch 28% Minority 85% Stability SCHOOL STAFF 2 half-day kindergarten teachers 3 classroom teachers each in 1-5 1 District Reading Specialist 3 Title I Teachers 1.5 Resource room/special ed teachers 1 PE teacher 1 librarian, 1 Librarian secretary 3 Specials teachers 9 paraprofessionals
Working harder and more effectively at 3rd grade Baseline year Washington Elementary School Growth in % of 3rd grade students meeting grade level standards School Year 95 96 97 98 99 00 01 02 03 04 05 06 Percent at Grade level 57 72 72 68 78 94 96 99 94 98 99 98
David Montague, Principal Washington Elementary “By the 3rd year, we had exhausted our work-harder-at-third-grade strategy…More of the catch-up gain had to be made at second and first grade. Our first-and second-grade teachers realized that they had to become more accountable for their students’ learning. Even our kindergarten teachers, who had spent most of their class time on social activities, began the transition to teaching phonemic awareness along with letter and sound recognition.”
Washington Elementary Kennewick School District Reading Block for 3 First Grade classrooms • 1st hour (8:45-9:45) • Small group instruction • 3 classroom teachers • 1 District Reading Teacher • 2 Title I teachers • Specials teacher • PE teacher • 6 paraprofessionals
Washington Elementary Kennewick School District During the Morning Reading Block Small group reading during 1st hour of the day • 13 adults with 75 students during the first hour in first grade • Struggling students get 1:3 with most skilled instructor • Advanced students get 1:7 ratios with paras and others • Afternoon Reading Block: • Many students get additional small group or 1:1 instruction time as interventions
Washington Elementary Kennewick School District The reading block for 3 first grade classrooms 2nd hour (9:45-10:45) Whole group instruction 1st hour (8:45-9:45) Small group instruction 3 classroom teachers 1 District Reading Teacher 2 Title I teachers Specials teacher PE teacher 6 paraprofessionals Also, during the second hour, paras, Title 1, and others work in small groups with 2nd-5th grades In the afternoon, many students are provided an additional 40-90 minutes of intervention
First Grade – Daily Reading Instruction 1st hour (8:45-9:45) Small group instruction The bell rings at 8:35 a.m. and a new school day begins in Stephanie Walton’s first – grade classroom.. After the flag salute and lunch count, her 22 students swiftly break into six small groups for the first hour of the morning reading block.
Three students go to the district reading specialist, three to the Title 1 teacher, while four head next door to learn with other students of their ability level. The teacher in the neighboring classroom sends over three of her students, and they take their places with three of Stephanie’s students. In the back of the room, seven students gather for direct instruction with a para-educator who follows Stephanie’s lesson plan as is within her listening range. In the hall, two students join a small reading group with the P.E. teacher.
First Grade – Daily Reading Instruction 2nd hour (9:45-10:45) Whole group instruction At about 9:43: Glancing up, Stephanie smiles at the students who are returning from other classes. “Your options are cards or workbook.” They know exactly what to do, and get right to work. She continues teaching until the rest of the students are back. At 9:47: Stephanie asks the entire class to come to the carpet area in the front of the room. In less than two minutes they are settled in the story area gazing at the cover of Things that Go.
2nd hour (9:45-10:45) Whole group instruction In 25 minutes, they use the same thematic material to do five different exercises to build vocabulary and comprehension Then the students move to their seats and spend the next 10 minutes on two workbook exercises reinforcing the meaning of five position words they just learned. They spend the rest of whole group time spelling on white boards
From David Motague “By the fifth year, I was convinced high performance reading was about more time and better use of that time. Students who were behind needed more direct instruction. Some of them started getting 60 to 90 minutes extra each day for a total of 180 to 210 minutes a day. We spent that time on the sub-skills they hadn’t mastered.”
Teacher Quality x Time = Growth “Quantity of instructional time can be doubled or tripled in a semester. Quality of instructional time cannot. Improving quality occurs over extended periods of time, at different rates for different teachers in the same school, as a constant process of arduous, intelligent labor.”
From David Motague “Growth is directly proportionate to the quality and quantity of instructional time. When we looked at our data student by student, we saw a painful fact with painful clarity. Most students who start behind stay behind. Time-starved reading programs that rely on sudden growth bursts from extraordinary instruction rarely move students from the 5th-30th percentiles up to grade level.” p. 48
Targeted Accelerated Growth The TAG Loop – Learning Partners 1. Diagnostic Testing 2. Proportional increases in direct instructional time 3. Teaching to the deficient sub-skill 4. Retesting to be sure the skill has been learned
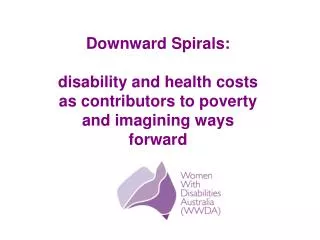
3rd Grade Interventions 2nd Grade Interventions % at Grade Level, 2003 1st Grade Reading Block 3rd Grade Reading Block 1st Grade Interventions 2nd Grade Reading Block % FR Lunch
Catch-up growth rarely occurs unless principals and teachers have good data, know each student’s learning needs, and schedule proportional increases in direct instructional time.” “This is why the primary and immediate strategy for catch-up growth is proportional increase in direct instructional time.” Teacher Quality x Time = Growth
Began providing intensive interventions in the afternoon to many students Working harder and more effectively at 3rd grade Result of improvement at both 2nd and 3rd Grade Baseline year Began testing in 2nd grade and focusing on earlier improvement Washington Elementary School Growth in % of 3rd grade students meeting grade level standards School Year 95 96 97 98 99 00 01 02 03 04 05 06 Percent at Grade level 57 72 72 68 78 94 96 99 94 98 99 98
What’s the Goal? All students who begin the year meeting grade level expectations continue to meet grade level expectations at the end of the year-they make expected yearly growth All students who begin the year reading below grade level accelerate their development so they make expected yearly growth plus catch-up growth
Whether or not we achieve these goals depends on the strength of our instruction to do two things during the year
Goal 1 Ensuring all students makeexpected yearly growth! 1. Strong core reading instruction for all students 2. Enough time spent to meet the needs of many students who do not typically receive powerful support at home 3. Enough quality so that the increased instructional time is spent effectively
Goal 2 Ensuring students who are behind make expected yearly growth - plus catch-up growth takes both! • Effective differentiated instruction by classroom teacher • Effective school-level systems and resources to provide additional intensive intervention in small enough groups for enough time, and with enough skill
Learning Partners Chapter 1Questions for Reflection and Discussion • In your efforts to assure each of your students will read at grade level, what strategies are you using to focus on “annual growth”? • What strategies are you using to focus on “catch-up growth”?
Book Group in a Bag Book Study Guide - handout
Some important questions for reflection What are the most important ways your school, or classroom is different now than three years ago? If large numbers of your students continue to struggle to make expected yearly growth, have you considered increasing the length of the reading block? Do students who struggle receive time for intervention instruction that is proportional to their difficulties? Do some students receive as much as 60-90 minutes of intervention every day?
It matters little what else they learn in elementary school if they do not learn to read at grade level. Fielding, L., Kerr, N., & Rosier, P. (2007). Annual growth for all students, catch-up growth for those who are behind. Kennewick, WA: The New Foundation Press, Inc.
To Order: New Foundation Press Phone: 509-783-2139 FAX: 509-783-5237