Download

1 / 23
230 likes | 339 Vues
This presentation highlights the analysis of racial and ethnic disparities in perinatal outcomes in the Bay Area between 1999 and 2001, focusing on fetal-infant mortality rates. Utilizing the Perinatal Periods of Risk (PPOR) model, we identify key risk factors such as maternal health and prematurity. The findings reveal significant gaps in perinatal care, emphasizing the need for targeted interventions. Our collaboration within the Bay Area Data Collaborative has strengthened data analysis and advocacy for better maternal and child health outcomes.

E N D
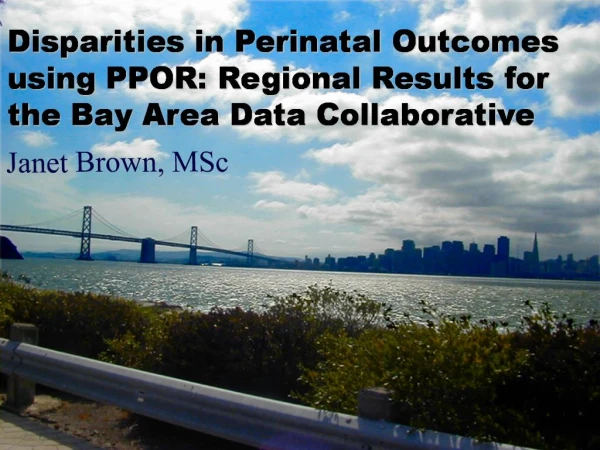
Disparities in Perinatal Outcomes using PPOR: Regional Results for the Bay Area Data Collaborative Janet Brown, MSc
Additional Authors: Al Abramowitz, MS Ellen J. Stein, MD, MPH, FACOG Anand Chabra, MD, MPH And Special Thanks To: Jerry A. Sierra BADC Collaborative CA Department of Health Services MCAH Branch Epi and Eval Section
Bay Area regional birth data have the statistical power to analyze racial/ethnic disparities • Distribution of African-American Population in the Bay Area
Objectives of Presentation • Present fetal-infant mortality rates for Bay Area counties • Identify health disparities • Identify risk factors using Perinatal Periods of Risk (PPOR) model
County and Bay Area Data CollaborativeFetal-Infant Mortality (FIM) Rates, 1999-2001 Rates per 1,000 * Source: CA Birth Cohort File, 1999-2001
BADC Region and County Fetal-Infant Mortality Rates and 95% Confidence Intervals, 2001
Racial/Ethnic Disparities: Bay Area Data Collaborative Region 20 Fetal-Infant Mortality Rates 18.3 18 Per 1,000 fetal deaths + births, 1999-2001 16.2 16 14 12 9.1 10 7.7 7.6 7.4 7.3 7.2 6.9 8 6.2 6 4 2 0 Black White Hispanic Asian/PI All Races BADC region Alameda Source: CA Birth Cohort File, 1999-2001
Perinatal Periods of Risk Parameters • Age at death • Birth weight Fetal-infant mortality
Maternal HealthPrematurity Maternal Care Infant Health Newborn Care Perinatal Periods of Risk Four “periods of risk” represent potential gaps in maternal and child health systems that lead to fetal-infant mortality
Fetal(24 Weeks to Birth) Neonatal(Birth to 27 Days) Postneonatal(28 Days to 1 Year) Perinatal Periods of Risk Analytic Model Age at Death Maternal Health/Prematurity Deaths (Rate) 500-1499 grams Birth Weight Maternal Care Deaths (Rate) Newborn Care Deaths (Rate) Infant Health Deaths (Rate) 1500+ grams Total Fetal Infant Mortality (FIM) Rate per 1,000 Total Deaths —————= Births + Fetal Deaths
Fetal(24 Weeks to Birth) Neonatal(Birth to 27 Days) Postneonatal(28 Days to 1 Year) BADC Black Distribution and Rates FIM, 1999-2001 Maternal Health/Prematurity 178 (8.1) 500-1499 grams 355 total deaths —————————— = 28,160 births + fetal deaths Maternal Care 90 (4.1) Newborn Care 25 (1.1) Infant Health 62 (2.8) 1500+ grams Total FIM Rate=16.2 per 1,000 Source: CA Birth Cohort File, 1999-2001
Fetal(24 Weeks to Birth) Neonatal(Birth to 28 Days) Postneonatal(29 Days to 1 Year) BADC, All Other, Distribution and Rates FIM, 1999-2001 Maternal Health/Prematurity768 (2.9) 500-1499 grams 1,855 total deaths —————= 266,310 births + fetal deaths Maternal Care 518 (1.9) Newborn Care 281 (1.1) Infant Health 288 (1.1) Total FIM Rate=7.0 per 1,000 1500+ grams Source: CA Birth Cohort File, 1999-2001
BADC Black, All Other FIM Disparities, 1999-2001 Maternal Health/PrematurityBlack: 8.1 All Other: 2.9 OR = 2.84 (95% CI 2.41- 3.34) Maternal Care Black: 4.1 All Other: 1.9 OR = 2.12 (95%CI 1.69 – 2.65) Newborn Care Black: 1.1All Other: 1.1 OR = 1.08 (95% CI .72 - 1.63) Infant Health Black: 2.8All Other: 1.1 OR = 2.63(95% CI 1.99-3.40) Black: 16.2, All Other: 7.0 Total OR = 2.35 (95% CI 2.10 – 2.64)
Fetal(24 Weeks to Birth) Neonatal(Birth to 27 Days) Postneonatal(28 Days to 1 Year) 500-1499 grams 1500+ grams Black Preventable Deaths BADC Region, 1999-2001 Against U.S. White Comparison Group, 1998-2000 Prematurity/Maternal Health 130 (58%) Maternal Care 57 (25%) Newborn Care 3 (1%) Infant Health 36 (16%) Total Excess Deaths=226
African American births are 7.5% of the total births for the Bay Area Preventable African American fetal-infant deaths are 1/3 of the excess mortality for the Bay Area
Maternal Health/Prematurity is our opportunity to reduce African American fetal and infant deaths
Bay Area Data Collaborative • Formed in Nov. 2004, meets bi-monthly, meeting location rotates • Members: MCH directors, medical directors, epidemiologists and others • Purpose • Share information • Serve as a resource • Conduct research
Bay Area Data Collaborative Successes • High level of commitment • Broad vision • Technical support/capacity building • Resource efficient: time and $ • Increased statistical power
Bay Area Data Collaborative Lessons learned • How to maintain project momentum • How to support diverse interests • How to manage different priorities
Maternal Health/Prematurity Risk Factors Black Fetal-Infant Mortality Trend1999-2002 PPOR Rate per 1,000 Source: CA Birth Cohort File, 1999-2002
Bay Area Population Change, 1980-2000 American Indian Asian-Pacific Islander Hispanic White African American