Download
1 / 1
10 likes | 174 Vues
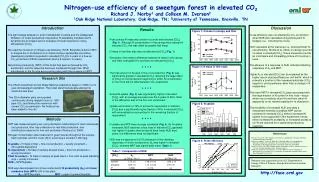
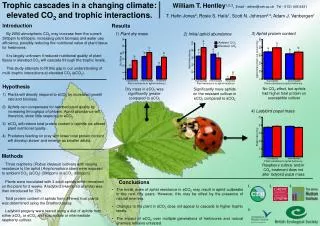
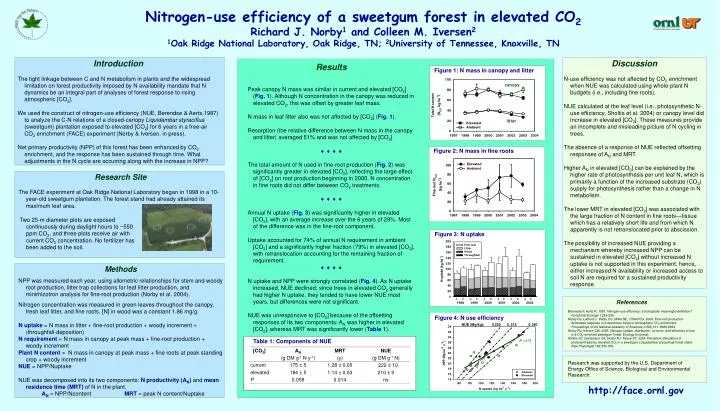
Figure 1: N mass in canopy and litter. canopy. litter. Figure 2: N mass in fine roots. Figure 3: N uptake. A E A E A E A E A E A E. Figure 4: N use efficiency. NUE (Mg/kg): 0.250 0. 215 0.180.

E N D
Figure 1: N mass in canopy and litter canopy litter Figure 2: N mass in fine roots Figure 3: N uptake A E A E A E A E A E A E Figure 4: N use efficiency NUE (Mg/kg): 0.250 0. 215 0.180 Research was supported by the U.S. Department of Energy Office of Science, Biological and Environmental Research. Nitrogen-use efficiency of a sweetgum forest in elevated CO2 Richard J. Norby1 and Colleen M. Iversen2 1Oak Ridge National Laboratory, Oak Ridge, TN; 2University of Tennessee, Knoxville, TN Introduction The tight linkage between C and N metabolism in plants and the widespread limitation on forest productivity imposed by N availability mandate that N dynamics be an integral part of analyses of forest response to rising atmospheric [CO2]. We used the construct of nitrogen-use efficiency (NUE, Berendse & Aerts,1987) to analyze the C-N relations of a closed-canopy Liquidambar styraciflua (sweetgum) plantation exposed to elevated [CO2] for 6 years in a free-air CO2 enrichment (FACE) experiment (Norby & Iversen, in press). Net primary productivity (NPP) of this forest has been enhanced by CO2 enrichment, and the response has been sustained through time. What adjustments in the N cycle are occurring along with the increase in NPP? Discussion N-use efficiency was not affected by CO2 enrichment when NUE was calculated using whole-plant N budgets (i.e., including fine roots). NUE calculated at the leaf level (i.e., photosynthetic N-use efficiency, Sholtis et al. 2004) or canopy level did increase in elevated [CO2]. These measures provide an incomplete and misleading picture of N cycling in trees. The absence of a response of NUE reflected offsetting responses of AN and MRT. Higher AN in elevated [CO2] can be explained by the higher rate of photosynthesis per unit leaf N, which is primarily a function of the increased substrate (CO2) supply for photosynthesis rather than a change in N metabolism. The lower MRT in elevated [CO2] was associated with the large fraction of N content in fine roots—tissue which has a relatively short life and from which N apparently is not retranslocated prior to abscission. The possibility of increased NUE providing a mechanism whereby increased NPP can be sustained in elevated [CO2] without increased N uptake is not supported in this experiment; hence, either increased N availability or increased access to soil N are required for a sustained productivity response. • Results • Peak canopy N mass was similar in current and elevated [CO2] (Fig. 1). Although N concentration in the canopy was reduced in elevated CO2, this was offset by greater leaf mass. • N mass in leaf litter also was not affected by [CO2] (Fig. 1). • Resorption (the relative difference between N mass in the canopy and litter) averaged 51% and was not affected by [CO2] • • The total amount of N used in fine-root production (Fig. 2) was significantly greater in elevated [CO2], reflecting the large effect of [CO2] on root production beginning in 2000. N concentration in fine roots did not differ between CO2 treatments. • • Annual N uptake (Fig. 3) was significantly higher in elevated [CO2], with an average increase over the 6 years of 29%. Most of the difference was in the fine-root component. • Uptake accounted for 74% of annual N requirement in ambient [CO2] and a significantly higher fraction (79%) in elevated [CO2], with retranslocation accounting for the remaining fraction of requirement. • • N uptake and NPP were strongly correlated (Fig. 4). As N uptake increased, NUE declined; since trees in elevated CO2 generally had higher N uptake, they tended to have lower NUE most years, but differences were not significant. • NUE was unresponsive to [CO2] because of the offsetting responses of its two components: AN was higher in elevated [CO2], whereas MRT was significantly lower (Table 1). • Research Site • The FACE experiment at Oak Ridge National Laboratory began in 1998 in a 10-year-old sweetgum plantation. The forest stand had already attained its maximum leaf area. Two 25-m diameter plots are exposed continuously during daylight hours to ~550 ppm CO2, and three plots receive air with current CO2 concentration. No fertilizer has been added to the soil. Methods NPP was measured each year, using allometric relationships for stem and woody root production, litter trap collections for leaf litter production, and minirhizotron analysis for fine-root production (Norby et al. 2004). Nitrogen concentration was measured in green leaves throughout the canopy, fresh leaf litter, and fine roots. [N] in wood was a constant 1.86 mg/g. N uptake = N mass in litter + fine-root production + woody increment + (throughfall-deposition) N requirement = N mass in canopy at peak mass + fine-root production + woody increment Plant N content = N mass in canopy at peak mass + fine roots at peak standing crop + woody increment NUE = NPP/Nuptake NUE was decomposed into its two components: N productivity(AN) and mean residence time (MRT) of N in the plant. AN = NPP/Ncontent MRT = peak N content/Nuptake References Berendse F, Aerts R. 1987. Nitrogen-use efficiency: a biologically meaningful definition? Functional Ecology 1:293-296. Norby RJ, Ledford J, Reilly CD, Miller NE, O'Neill EG. 2004. Fine-root production dominates response of a deciduous forest to atmospheric CO2 enrichment. Proceedings of the National Academy of Sciences (USA) 101: 9689-9693. Norby RJ, Iversen CM. 2005. Nitrogen uptake, distribution, turnover, and efficiency of use in a CO2-enriched sweetgum forest. Ecology (in press). Sholtis JD, Gunderson CA, Norby RJ, Tissue DT. 2004. Persistent stimulation of photosynthesis by elevated CO2 in a sweetgum (Liquidambar styraciflua) forest stand. New Phytologist 162:343-354. Table 1: Components of NUE R2 = 0.72 http://face.ornl.gov