4. Nitrogen Use Efficiency
4. Nitrogen Use Efficiency. SOIL 5813 Soil-Plant Nutrient Cycling and Environmental Quality Department of Plant and Soil Sciences Oklahoma State University Stillwater, OK 74078 email: wrr@mail.pss.okstate.edu Tel: (405) 744-6414. 4. Nitrogen Use Efficiency


4. Nitrogen Use Efficiency
E N D
Presentation Transcript
4. Nitrogen Use Efficiency SOIL 5813 Soil-Plant Nutrient Cycling and Environmental Quality Department of Plant and Soil Sciences Oklahoma State University Stillwater, OK 74078 email: wrr@mail.pss.okstate.edu Tel: (405) 744-6414
4. Nitrogen Use Efficiency • In grain production systems, N use efficiency seldom exceeds 50 percent. Variables which influence N use efficiency include • a. Variety • b. N source • c. N application method • d. Time of N application • e. Tillage • f. N rate (generally decreases with increasing N applied) • g. Production system • 1. Forage • 2. Grain
Olson and Swallow, 1984 (27-33% of the applied N fertilizer was removed by the grain following 5 years) • h. Plant N loss • i. Soil type (organic matter) • Calculating N Use Efficiency using The Difference Method • ______________________________________________________________________ • Applied N Grain Yield N content N uptake Fertilizer Recovery • kg/ha kg/ha % kg/ha % • ______________________________________________________________________ • 0 1000 2.0 20 - • 50 1300 2.1 27.3 (27.3-20)/50=14.6 • 100 2000 2.2 44 (44-20)/100=24 • 150 2000 2.3 46 (46-20)/150=17 • ______________________________________________________________________
N use efficiency for grain production systems: 20 to 50%. • Example does not include straw, thus, recovery levels are lower. • Analysis of forage production systems (Altom et al., 1996) demonstrates that N use efficiency can be as high as 60-70%. • plant is harvested prior to flowering, minimizing the potential for plant N loss. • plant N loss is known to be greater (flowering to maturity) • N use efficiencies in forage production systems do not decrease with increasing N applied as is normally found in grain production systems. • Suggests 'buffering' whereby increased N is lost at higher rates of applied N in grain production systems, but which cannot take place in forage production systems.
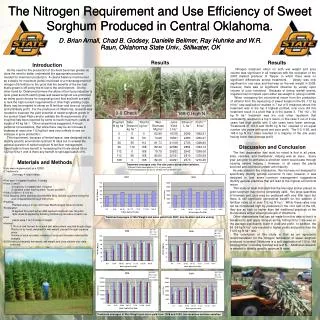
100 Time of N Applied Fall 90 Split Spring 80 N use efficiency, % 70 60 50 50 75 100 150 200 N Rate, lb/acre Estimated fertilizer N use efficiency as affected by N rate and time of application, Burneyville, OK, 1979-1992 (Altom et al., 1996)
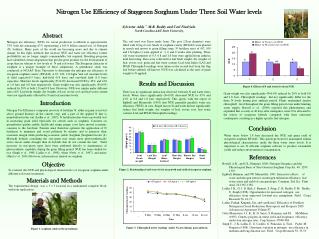
Moll et al. (1982) • presence of two primary components of N use efficiency: • efficiency of absorption or uptake (Nt/Ns) • efficiency with which N absorbed is utilized to produce grain (Gw/Nt) • Nt = total N in the plant at maturity (grain + stover) • Ns = nitrogen supply or rate of fertilizer N • Gw = grain weight (all expressed in the same units) • Consideration of additional parameters not discussed in Moll et al. (1982) *plant N loss • Maximum N accumulation has been found to occur at or near flowering in wheat and corn and not at harvest. • In order to estimate plant N loss without the use of labeled N forms, the stage of growth where maximum N accumulation is known to occur needs to be identified. • The amount of N remaining in the grain + straw or stover, is subtracted from the amount at maximum N accumulation to estimate potential plant N loss (difference method). • Use of difference methods for estimating plant N loss are flawed since continued uptake is known to take place beyond flowering or the point of maximum N accumulation.
Figure 4.1 Total N uptake in winter wheat with time and estimated loss following flowering.
Francis et al. (1993) Plant N losses accounted for 73% of the unaccounted-for N in 15N balance calculations. • Gaseous plant N losses could be greater when N supply was increased • Maximum N accumulation in corn occurred soon after flowering (R3 stage of growth). • Francis et al. (1993): Importance of plant N loss on the development and interpretations of strategies to improve N fertilizer use efficiencies. • Harper et al. (1987): 21% of the applied N fertilizer was lost as volatile NH3 in wheat • Francis et al. (1993): Failure to include plant N loss leads to overestimation of N loss from the soil by denitrification, leaching and ammonia volatilization.
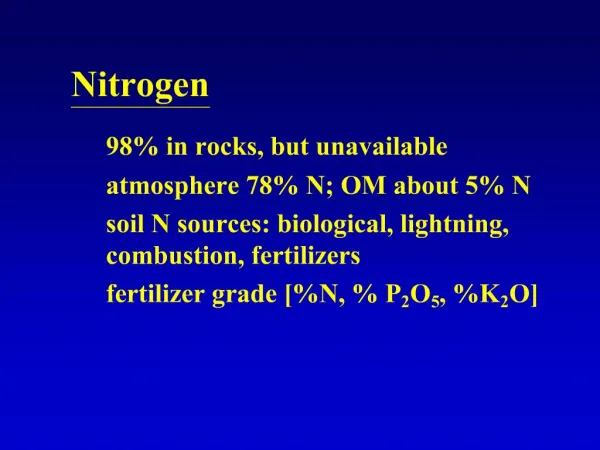
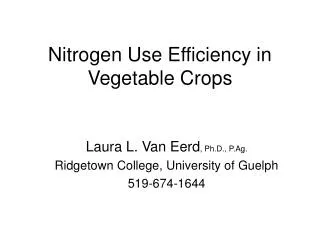
NO3- + 2e (nitrate reductase) NO2- + 6e (nitrite reductase) NH4+ • Reduction of NO3- to NO2- is the rate limiting step in the transformation of N into amino forms. photosynthesis carbohydrates respiration reducing power carbon skeletons NADH or NADPH amino NH NO NO 3 3 2 acids nitrate nitrite reductase reductase ferredoxin siroheme
Does the plant wake up in the morning and turn on the TV to check the weather forecast, to see if it should assimilate NO3 and attempt to form amino acids? • Could we look at the forecast and attempt to communicate with the plant, letting it know that weather conditions will be good (or bad), thus proceeding with increased NO3 uptake? • Major pathways for assimilation of NH3 • 1. incorporation into glutamic acid to form glutamine, a reaction catalyzd by glutamine synthetase (Olson and Kurtz, 1982) • 2. Reaction of NH3 and CO2 to form carbamyl phosphate, which in turn is converted to the amino acid arginine. • 3. Biosynthesis of amides of amides by combination of NH3 with an amino acid. In this way aspartic acid is converted to the amide, asparagine
VEGETATIVE REPRODUCTIVE R-NH2 NO3 NH4 R-NH2 Total N moistureheat Total N NH3 amino NH NO NO 3 3 2 acids nitrate reductase nitrite reductase • NO3- + 2e (nitrate reductase) NO2- + 6e (nitrite reductase) NH4+
Means over N rate and variety for protein, NUE components and estimated plant N loss, Perkins, OK 1995 _________________________________________________________________________________________ Protein N-use Uptake N-utilization Fraction of Grain yield/ N loss % efficiency efficiency efficiency N translocated grain N (kg ha-1) (Gw/Ns) (Nt/ Ns) (Gw/Nt) to grain(Ng/Nt) (Gw/Ng) (Nf-(Ng+Nst) N rate, kg ha-1 -------------------------------------------------------- means -------------------------------------------------------- 0 14.8 0 0 23.2 0.60 38.8 16.4 45 15.9 23.3 1.0 22.9 0.63 36.5 25.0 90 17.4 11.0 0.6 20.2 0.61 33.2 25.8 180 17.6 7.0 0.4 20.5 0.62 33.5 31.4 SED 0.40 1.1 0.05 1.12 0.03 0.89 6.74 Variety: Chisholm 16.3 11.8 0.5 22.4 0.6 35.3 21.8a Karl 17.5 13.1 0.6 23.0 0.7 33.0 26.6a 2180 17.4 18.1 0.8 22.7 0.7 33.4 27.9a TAM W-101 15.5 11.7 0.6 21.4 0.6 37.4 24.7a Longhorn 15.0 14.7 0.8 19.5 0.5 38.5 22.3a SED 0.45 1.5 0.07 1.27 0.04 1.18 7.33 _________________________________________________________________________________________
NUE for food production • efficiency of the plant to assimilate applied N • once assimilated, the ability retain & incorporate N into the grain • efficiency of the soil to supply/retain applied N for plant assimilation over long periods of time • composite system efficiency. • Uptake efficiency estimated as Nf/Ns (Eup) instead of Nt/Ns (Eha).More N is assimilated at earlier stages of growth, therefore, uptake efficiency should be estimated at the stage of maximum N accumulation and not at maturity when less N can be accounted for. The component Nt/Ns as proposed by Moll et al. would be better defined as harvest uptake efficiency or physiological maturity uptake efficiency. We define uptake efficiency as the stage where maximum N is taken up by the plant divided by the N supplied.
1. Uptake efficiency Eup=Nf/Ns Unlike the description by Moll et al. (1982), uptake efficiency should be partitioned into two separate components since plant N loss (from flowering to maturity) can be significant. Fraction of N translocated to the grain should be estimated as Ng/Nf and not Ng/Nt as proposed by Moll et al. (1982) since more N was accumulated in the plant at an earlier stage of growth. Plants losing significant quantities of N as NH3 would have very high fractions of N translocated to the grain when calculated using Nt instead of Nf. In terms of plant breeding efforts, this could be a highly misleading statistic. A second component, the translocation index is proposed that would reflect the ability of a plant genotype or management practice to incorporate N accumulated at flowering into the grain.
2. fraction of N translocated to the grain Et=Ng/Nf 2. translocation index Eti=Ng/Nf * (1/Nl) Ability of the soil-plant system to utilize outside sources of N for food production (grain or forage) depends on the efficiency of storage in the soil. The efficiency of the soil to supply N to plants is strongly influenced by immobilization and mineralization with changing climate and environment. Over a growing season, storage efficiency will be equal to the difference between fertilizer N added (Ns) minus maximum plant uptake (Nf) plus the difference between total soil N at the beginning and end of the season, all divided by fertilizer N added. Esg = [(Ns-Nf)-(St1-St2)]/Ns 3. soil (management system) supply efficiency, Es=Ns/(Sv+Sd+Sl) where Sv, Sd and Sl are estimates of soil volatilization, denitrification and leaching losses from the soil, respectively. Lastly, a composite estimate of efficiency for the entire system (soil and plant) can be estimated as follows 4. composite system efficiency Ec=Eup*Es=Nf/(Sv+Sd+Sl)
It is important to note that these efficiency parameters can be determined without having to determine total N in the soil. Avoiding total soil N analyses is noteworthy since the precision of present analytical procedures (Kjeldahl or dry combustion) approach ± 0.01%. This translates into approximately ± 220 kg N/ha (depending on soil bulk density) which is often greater than the rate of N applied, thus restricting the ability to detect N treatment differences. Will Increased NUE lead to Increased NO3 leaching? Data from Kanampiu et al. (1995) NUE Sinks: Increased NUE No Change ------------- kg / ha --------------Total N Applied 180 180Plant N uptake (at flowering) 68 71Final Grain N uptake 42 40Plant N loss 26 31Denitrification 10 15Immobilization 80 80Balance 22 14Leaching ? ?
Component Abbreviation Unit Grain weight Gw kg ha-1Nitrogen supply (rate of fertilizer N) Ns kg ha-1Total N in the plant at maturity (grain + stover) Nt kg ha-1N accumulation after silking Na kg ha-1N accumulated in grain at harvest Ng kg ha-1Stage of growth where N accumulated in the plant is at a maximum, at or near flowering Nf kg ha-1Total N accumulated in the straw at harvest Nst kg ha-1Estimate of gaseous loss of N from the plant Nl =Nf-(Ng+Nst) kg ha-1Flowering uptake efficiency Eup=Nf/Ns Harvest uptake efficiency (Uptake efficiency) Eha=Nt/Ns Translocation index (accumulated N at flowering translocated to the grain) Eti =Ng/Nf * (1/Nl) Soil supply efficiency Es=Ns/(Sv+Sd+Sl) Composite system efficiency Ec=Eup*Es=Nf/(Sv+Sd+SI)Utilization efficiency Gw/Nt Efficiency of use Gw/Ns Grain produced per unit of grain N Gw/Ng Fraction of total N translocated to grain Et=Ng/Nt Fraction of total N accumulated after silking Na/Nt Ratio of N translocated to grain to N accumulated Ng/Na after silking
N Discussion Magruder Plots 1892: 4.0 % organic matter = 0.35+ 1.8 OCOC = 2.03TN = 0.16Pb = 1.623 (0-12") lb N/ac = Pb * ppm N * 2.7194= 1.623 * 1600 * 2.7194 = 7061+ 10 lbs N/year in the rainfall = 1050 (105 * 10)= 8111 1997OC = 0.62TN = 0.0694 lb N/ac = 1.623*694 * 2.7194=3063 Difference: 8111 - 3063 = 5048 lbs N
Grain N removal14.6 bu/ac * 60 lb/bu = 876 lbs876 lbs * 105 years = 91980 lbs grain91980 lbs * 0.022086 %N = 2031 lbs N Plant N loss10.7 lb/ac/yr (Kanampiu et al., 1995, avg. of 2 experiments)105 * 10.7 = 1130 lbs N Denitrification 2.85 lb/ac/yr (Aulakh et al. 1984)105 * 2.85 = 300 lbs N Balance 1537 lbs N Year 1 denitrification, ammonificationDenitrification, ug/g = 50.0 * OC + 6.2 (Burford and Bremner, 1975, p. 391)= 50.0 * 2.03 + 6.2= 107.7 ug/g= 107.7 * 1.623 * 2.7194 = 475.34 lb/ac (0-12") New Balance 1062 lb N/ac (10.11 lb N/ac/yr unaccounted)
Not included in this balance sheet is the amount of N that would be lost via ammonification. Denitrification losses the first year were likely much higher since increased NO3-N would have been present as a result of mineralized N from a very large total N pool. Burford and Bremner (1975) applied the equivalent of 800 lb NO3-N/ac and found that denitrification losses were extremely high. Although their work has little relevance to annual denitrification losses expected under field conditions, it does provide some insight into what might have happened in the first year when soils were first tilled. Miscellaneous When adequate inorganic N was present, the incorporation of straw in conventional till or the application of straw on the surface of zero till approximately doubled the accumulative gaseous N losses (increased supply of energy to denitrifying organisms). Aulakh et al. (1984) From 71 to 77% of the surface applied fertilizer N remaining in the profiles was in the 0 to 0.1 m soil layers (Olson and Swallow, 1984). Late N application can be efficiently taken up by plants, and does not decrease soil N uptake. To achieve acceptable grain protein levels for bread wheat in this irrigated cropping system, N should be supplied late in the season to improve N uptake during grain fill (Wuest and Cassman, 1992)