Download
1 / 10
110 likes | 372 Vues
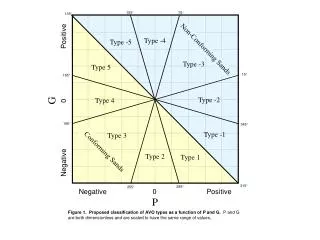
105 . 75 . 135 . Type -4. Type -5. Non-Conforming Sands. Type -3. Type 5. 15 . 165 . G. Type -2. Negative 0 Positive. Type 4. 195 . 345 . Type -1. Type 3. Conforming Sands. Type 2. Type 1. 315 . 285 . 255 .

E N D
105 75 135 Type -4 Type -5 Non-Conforming Sands Type -3 Type 5 15 165 G Type -2 Negative 0 Positive Type 4 195 345 Type -1 Type 3 Conforming Sands Type 2 Type 1 315 285 255 Negative 0 Positive P Figure 1. Proposed classification of AVO types as a function of P and G. P and G are both dimensionless and are scaled to have the same range of values.
Conforming Sands Non-Conforming Sands Type -3 Type -2 + + Type -1 Type 1 Type -4 Increasing Increasing Offset Amplitude 0 0 Offset Amplitude Type -5 Type 2 Type 3 Type 5 Type 4 Figure 2. General relationships between the amplitude of the reflection at normal incidence and the amplitude of the reflections with increasing offset for the different AVO types.
5 4 3 G 2 1 -1 -2 -3 -4 -5 AVO Type P Figure 3. Scatter plot showing distribution of real data set evaluated using the proposed classification scheme. Each sample in the siemic data set is evaluated for P and G; the whole set of P’s and G’s is scaled; and, the points are plotted accordingly. Color codes are assigned according to the divisions laid out in Figure 1 (and reproduced by the diagonal black lines here). The color-coded points may then be output using an appropriate SEGY format and displayed as record sections
b a c Type 1 AVO Top of Sand Top of Sand Top of Sand Gas/Water Gas/Water Gas/Water Base of Sand Base of Sand Base of Sand Type -1 AVO AVO Types Section Stacked Section Lithology Section Figure 4. Overpressured gas sand with gas water contact. A sand bed (outlined in yellow) displays non-conforming, type –1 AVO characteristics in a downdip position; the presence of gas in the updip portions of the bed causes it to become conforming and display type 1, 2, and 3 AVO characteristics. The letters a, b, and c on the Stacked Section refer to the arm, palm and fingers of the “cupped hand” as described in the text. Every second trace from the stack is superposed on the AVO Types and Lithology sections. Data courtesy of Fairfield Industries Inc.
Note how the top of the sand moves up relative to the zero-offset peak as the sand undergoes a transition from non-conforming to conforming. Type -1 non-conforming sand Type 1 conforming sand Figure 5. Panels of gathers showing change in AVO types for an overpressured sand with a gas water contact. A type -1 is illustrated in the in the two panels on the left hand side. A type 1 is well-defined in the two panels on the right hand side. Gathers are taken from the example illustrated in Figure 4 and the lithology in the background is also from Figure 4. Data courtesy of Fairfield Industries Inc.
Well Time-scaled log analysis and synthetic seismogram Gathers with lithology Gathers with AVO types Figure 6. Gas-bearing sand underlying a tight sand. This composite image shows lithology, gathers and a well log analysis, with every second wiggle trace from the stacked section; insets on the left show gathers with lithology and AVO types in the background. A third inset shows the time-scaled lithology interpretation from a well drilled, at the location marked, plus a set of synthetic traces; the tie between the stratigraphy, the lithologic interpretation and the AVO types is demonstrated. Carbonate-rich rocks are colored blue on the well log.
Figure 7. Panels of gathers showing change in AVO types with a change in lithology for a gas-bearing sand underlying a tight sand. Gathers are taken from the vicinity of the gas-water contact in the example illustrated in Figure 6. The gathers are superposed on lithology at the top and AVO type at the bottom; lithology and AVO type are from Figure 6 . The top of the calcite-cemented, non-conforming sand is characterized by AVO types –2, -3, and –4: all positive amplitudes either increasing with offset or remaining flat. The porous, conforming, lower sand is characterized by AVO types 2, 3, and 4: all negative amplitudes either increasing or remaining flat with offset.
Tight Non-Conforming Sand Tight Non-Conforming Sand Tight Non-Conforming Sand Gas/Water Gas/Water Gas/Water Porous Conforming Sand Porous Conforming Sand Porous Conforming Sand AVO Types Section Lithology Section Stacked Section Figure 8 . Detail on Figure 6 - gas-bearing sand underlying a tight sand. A sand section (outlined in yellow) displays non-conforming, AVO types (indicated by pastel shades in middle panel) in the top portion, where it is heavily cemented with calcite and conforming AVO types (indicated by bright colors in middle panel) in the bottom portion, where it is porous and contains a gas-bearing reservoir lying on water. Every second trace from the stack is superposed on the AVO Types section.
Well Non-conforming Sands Gas-filled, Conforming Sand AVO Types Section Lithology Section Figure 9. AVO types and lithology sections illustrating conformable and non-conformable sands in separate beds. The upper beds are relatively well-lithified and tight, while the lower bed is gas-filled and relatively more porous. The non-conformable sands range from AVO types –1 to –3 and show a characteristic peak over trough relationship in the stack, whereas the conformable sand is dominantly AVO type 3 and characterized by a trough over peak relationship in the stack. Color bar for the AVO types section is the same as in Figure 3; shales are green, sands are brown to yellow and gas sands are red in the lithology section.
Non-conforming Sands Gas-filled, Conforming Sand AVO Types Section Lithology Section Figure 10. Gathers from the vicinity of the well in Figure 9 superposed on AVO types and lithology sections. The upper beds are relatively well-lithified and tight, while the lower bed is gas-filled and relatively more porous. The non-conforming sands are mostly AVO type –1 and –2 , characterized by a peak either losing amplitude or remaining flat with offset. The conforming sand is dominantly AVO type 3 characterized by a trough increasing slightly with offset. Color bar for the AVO types section is the same as in Figure 3; shales are green, sands are brown to yellow and gas sands are red in the lithology section.