Download

1 / 79
790 likes | 918 Vues
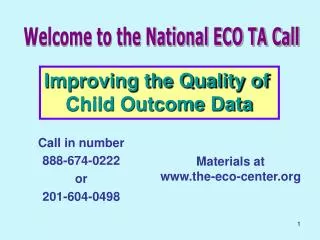
Welcome to the National ECO TA Call . Improving the Quality of Child Outcome Data. Call in number 888-674-0222 or 201-604-0498. Materials at www.the-eco-center.org. Reminder. ECO looking for states to partner in framework development activities

E N D
Welcome to the National ECO TA Call Improving the Quality of Child Outcome Data Call in number 888-674-0222 or 201-604-0498 Materials at www.the-eco-center.org
Reminder • ECO looking for states to partner in framework development activities • Call for states interested in the partner state application on March 20, 3 pm EDT/ 2 p.m.CDT/1 p.m. MDT/Noon PDT. • See www.the-eco-center.org for application and call in information.
Today’s Presenters • Christina Kasprzak, ECO at FPG • Lynne Kahn, ECO at FPG • Kathy Hebbeler, ECO at SRI • Lisa Backer, Minnesota
To ask a question during the presentation • Use the chat box • If you can’t see the chat box, click on the triangle in front of “Chat” to expand the box • Type your question in the box “Type chat message here” • Send to All Participants.
Key to Good Data Have a good outcome measurement SYSTEM
Examples of Components of an Outcomes Measurement System • Data collection procedures • Professional development around data collection --- and data analysis • Ongoing supervision and monitoring of data collection • Ongoing analyses to check on the quality of the data • Etc.
Building quality into your outcomes measurement system • Occurs at multiple steps • Requires multiple activities
Building quality into your outcomes measurement system • Keep errors from occurring in the first place • Develop mechanisms to identify weaknesses that are lessening the quality of the data • Provide ongoing feedback including reports of the data to programs and providers
Different approaches present different kinds of challenges to quality data • For states using COSF • Are all professionals trained in the process? • Are all professionals applying the rating criteria consistently? • For states deriving OSEP data from an assessment • Are all professionals trained in the assessment and administering it properly? • Are the appropriate items/domains being used for each outcome? • Are the appropriate “cut points” or criteria for age appropriate and moved nearer to same age peers being used?
Today’s Focus: Using data analysis to check on the quality of your data • Remember this is only weighing the pig • Weighing the pig does not make it fatter • Need to take what you learn from the analysis and do something with it.
Child Outcomes Data Quality • So what do you look at to know? • Our game plan • Walk through a series of expected patterns and look at the corresponding analyses • These data are being shared as a teaching tool. Do not cite the data. • Do consider the analyses as a way to examine your own state data.
Using data for program improvement = EIA Evidence Inference Action
Evidence • Evidence refers to the numbers, such as “45% of children in category b” • The numbers are not debatable
Inference • How do you interpret the #s? • What can you conclude from the #s? • Does evidence mean good news? Bad news? News we can’t interpret? • To reach an inference, sometimes we analyze data in other ways (ask for more evidence)
Inference • Inference is debatable -- even reasonable people can reach different conclusions from the same set of numbers • Stakeholder involvement can be helpful in making sense of the evidence
Action • Given the inference from the numbers, what should be done? • Recommendations or action steps • Action can be debatable – and often is • Another role for stakeholders
Quality Checks • Missing Data • Pattern Checking
Missing Data - Overall • How many children should the state be reporting to OSEP in the SPP/APR table? • i.e., how many children [had entry data,] exited in the year, and stayed in the program 6 months? • Do you have a way to know? • What percentage of those children do you have in the table? • These questions apply whether or not you are sampling.
Are you missing data selectively? • By local program • By child characteristic • Disability? • Type of exit? (children who exit before 3) • By family characteristic • Families who are hard to reach (and may leave unexpectedly) ***Which of these can you check on?***
Poll Time!! • If you can’t see the poll area: • If you see 3 bars after “polling”, click on the word “polling.” • If you only see the word “polling,” click on the triangle in front of “polling”. • You can make the polling area bigger by dragging the vertical line between the slides and the poll area. You also can minimize the participants list (click the – in the corner of the participants box). • When you see the poll question, click on your answer.
Pattern Checking 3 Possible Sets of Numbers • OSEP Progress Categories • Entry Data • Exit Data
OSEP Progress Categories • Did not improve functioning. • Improved functioning but not enough to move closer to same-age peers. • Improved functioning to a level nearer to same-age peers but did not reach it. • Improved functioning to reach a level comparable to same-age peers. • Maintained functioning at a level comparable to same-age peers.
Looking for Sensible Patterns in the Data • Putting together your “validity argument.” • You can make a case that your data are valid if …..they show certain patterns. • The quality of your data is not established by one or two numbers. • The quality of the data is established by a series of analyses that demonstrate the data are showing predictable patterns.
Predicted Pattern #1 1a. Children will differ from one another in their entry scores in reasonable ways (e.g., fewer scores at the high and low ends of the distribution, more scores in the middle). . 1b. Children will differ from one another in their exit scores in reasonable ways. 1c. Children will differ from one another in their OSEP progress categories in reasonable ways.
Rationale Evidence suggests EI and ECSE serve more mildly than severely impaired children (e.g., few ratings/scores at lowest end). Few children receiving services would be expected to be considered as functioning typically (few ratings/scores in the typical range).
Predicted Pattern #1 (cont’d) Analysis • Look at the distribution of rating/scores at entry and exit and the data reported to OSEP. • Look at the percentage of children who scored as age appropriate (or not) on all three outcomes at entry and at exit. Question: Is the distribution sensible? What do you expect to see?
Poll Time!! • If you can’t see the poll area: • If you see 3 bars after “polling”, click on the word “polling.” • If you only see the word “polling,” click on the triangle in front of “polling”. • You can make the polling area bigger by dragging the vertical line between the slides and the poll area. You also can minimize the participants list (click the – in the corner of the participants box). • When you see the poll question, click on your answer.
Entry & Exit Data
State with Scores: Distribution of entry scores on Outcome 1
Fake Data: OSEP progress categories • Possible Problems: • Too many children in “a” • Too many children in “e”
Poll Time!! • If you can’t see the poll area: • If you see 3 bars after “polling”, click on the word “polling.” • If you only see the word “polling,” click on the triangle in front of “polling”. • You can make the polling area bigger by dragging the vertical line between the slides and the poll area. You also can minimize the participants list (click the – in the corner of the participants box). • When you see the poll question, click on your answer.
Predicted Pattern #2 2. Functioning in one outcome area will be related to functioning in the other outcome areas. Analyses: Look at the relationship across the outcomes at entry, at exit, across the OSEP progress categories. 1. Crosstabs 2. Correlation coefficient Question: What do we expect to see?
Rationale For many, but not all, children with disabilities, progress in functioning in the three outcomes proceeds together
MN: Crosstabulation with Progress Categories: 619: Know/Skills to Soc/Emot
Correlation Coefficient • Useful statistic • Range: 0 to 1 • Can be negative • Measure of extent of a relationship between 2 sets of numbers • Closer to 1, stronger the relationship • Negative correlation means as one set of numbers goes up, the other goes down.
MN619: Correlation coefficients between exit scores for the 3 outcomes (N=3,160)
MNPart C: Correlation coefficients among entry scores for the 3 outcomes
Predicted Pattern #3 • Functioning at entry within an outcome area will be related to functioning at exit (or – children who have higher functioning at entry in an outcome area will be the ones who are high functioning at exit in that outcome area). Analyses: 1. Correlation coefficients between entry and exit scores for each outcome 2. Crosstabs between entry and exit scores for each outcome Question: What do we expect to see?
MN Part C: Correlation coefficients between entry and exit scores
Predicted Pattern #4 4. Most children will either hold their developmental trajectory or improve their trajectory from entry to exit. Analyses: 1. Comparison of distributions of COSF ratings, standard scores, or some other metric that takes age into account. (Why can’t we use raw scores on an assessment for this?) at entry and exit. Question: What do we expect to see?