Download
1 / 72
720 likes | 868 Vues
Presentations May 23 – 25, 2005 Portland, Maine For related information visit: http://www.newmoa.org/prevention/mercury/conferences. UNEP’s Global Mercury Program.

E N D
Presentations May 23 – 25, 2005 Portland, Maine For related information visit: http://www.newmoa.org/prevention/mercury/conferences
UNEP’s Global Mercury Program By Charles French, U.S. EPA May 23, 2005 Portland, Maine
Mercury Pollution: a Global Issue • Mercury is toxic, persistent, and bioaccumulates in food chains • Mercury is released from various sources throughout the world • These releases can be transported great distances through air and oceans, easily crossing national borders, cycling globally • Even nations with minimal mercury releases, and areas remote from industrial activity (such as the Arctic) are adversely affected • Current releases add to the “global pool”…..
GLOBAL MERCURY CYCLE Most mercury entering environment is due to emissions to air, but mercury is also released to water and land from various sources Courtesy of Rita Schoeny U.S. EPA. Adapted from U.S. Dept. of Interior’s Report on Hg in the Florida Everglades
Many humans/wildlife across the globe may be at risk • Largely due to consumption of fish; • Also due to other sources of exposure (such as artisanal mining and other occupations, cosmetics, spills, ritualistic uses, etc…) Artisinal gold mining/panning in Lao PDR - UNIDO photo
1990 Africa Asia 9% 38% Africa Asia South America 18% 52% 3% South America North America 4% 14% North America 9% Australia Europe Europe 6% 33% 11% Anthropogenic Air Emissions of Mercury by Region in 1990 and 2000 2000 Total: 1,881 metric tons/yr Total: 2,269 metric tons/yr Note: Significant emissions also occur due to natural sources, and re-emissions from historic anthropogenic sources. Based on Pacyna, J., Munthe J., Presentation at Workshop on Mercury: Brussels, March 29-30, 2004
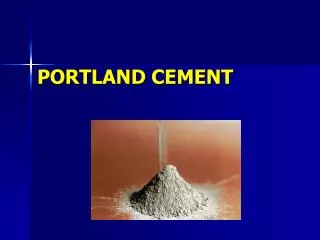
Anthropogenic Air Emissions of Mercury by Industrial Sector in 1995 Non-ferrous metal production 170 (7%) • Estimates are uncertain; most countries do not have Hg inventories Pig iron and steel production 30 (1%) Cement production 130 (5%) Coal/Fuel combustion 1470 (62%) Waste disposal 110 (5%) Artisanal gold mining 300 (13%) Chlor-alkali 172 (7%) Total: 2,382 metric tons Source: Estimates derived from data in the 2002 UNEP Global Mercury Assessment
EPA Model of Contribution of U.S. vs. International Sources to Mercury Deposition • Based on modeling about half of U.S. mercury deposition is from U.S. anthropogenic sources and half is from other sources • Domestic sources dominate deposition for large part of Eastern U.S. • Global sources are dominant in the Western U.S. Source: REMSAD model
Relative Contribution of Domestic vs. International Sources to fish mercury levels U.S. Domestic Emissions International Emissions (Global Pool) Deposition Farm Fish Waterways Freshwater Fish (East) Atlantic Coastal/ Gulf Fish Freshwater Fish (West) Other Marine Fish Increasing Domestic Percentage Contribution Increasing International Percentage Contribution
United Nations Environment Program (UNEP) • UNEP, in collaboration with other organizations, has been pivotal in raising global awareness of mercury pollution • The mandates, priorities, and scope of work for UNEP are largely determined by the UNEP Governing Council (GC), which holds a general session every 2 years
UNEP Global Mercury Assessment (GMA) Report • Completed in 2002 by UNEP Working Group • Initiated by UNEP GC in February 2001 (during 21st Session) • Extensive info on global mercury pollution, including sources of releases, uses in products and processes, fate & transport, toxicity, exposures, and prevention/control measures
UNEP GC Decision in February 2003 (22nd Session) • Concluded there is sufficient evidence of significant global adverse impacts to warrant further international action • Decided national, regional and global actions should be initiated ASAP • Urged all countries to adopt goals and take actions to identify exposed populations & reduce releases • Requested UNEP to initiate technical assistance and capacity building activities • Established the UNEP Mercury Program
UNEP Mercury Program 2003/05 • Hosted 7 Regional Awareness Raising Workshops • In Argentina, Lebanon, Senegal, South Africa, Thailand, Ukraine, and Trinidad and Tobago • Drafting guidance materials to help countries: • Develop Inventories of Mercury Releases • Identify Populations at Risk • Others • Establish and maintain an information Clearinghouse
UNEP GC Decision in February 2005 (the 23rd Session) • Requests UNEP to: • Further develop the Mercury Program • Prepare a report summarizing supply, trade and demand information on mercury, including in artisanal mining • Encourages Governments to: • “promote and improve evaluation and risk communication methods…..”
UNEP GC Decision in February 2005 (23rd Session) • Requests Governments, private sector, etc... to take immediate actions to reduce risks posed by mercury in products and processes • Considering application and sharing of Best Available Techniques to reduce emissions… • Action on reducing risk of exposure related to mercury in products (such as batteries) and processes (such as chlor-alkali plants) • Consider curbing primary mercury production
UNEP GC Decision in February 2005 (23rd Session) • Urges Governments, IGOs, NGOs, and private sector to develop & implement partnerships… as one approach to reducing the risks due to the release of mercury to environment • Requests UNEP to: • Invite Governments to identify priority partnership areas ASAP, with the goal of identifying a set of pilot partnerships by September 1, 2005 • Report on progress of the partnerships to GC at the 24th Session (February 2007)
UNEP GC Decision in February 2005 (23rd Session) • Requests UNEP to facilitate work among various stakeholders to: • Improve understanding of sources, fate, transport • Promote development of inventories • Promote development of environmentally sound disposal and remediation practices • To increase awareness of environmentally sound recycling practices • Decides to assess at next Session (February 2007) the need for further action, considering the full range of options, including the possibility of a legally binding instrument, partnerships and other actions
U.S. Government Support • U.S. Government provides significant support to the Program, including financial, technical, staff time, etc… • Largest Donor: • $1.3 million in 2003-04 • Plan to contribute over $1.5 million in 2005
U.S. Government Involvement • Pleased with GC decision, and especially interested in establishing partnerships in the following areas: • Chlor-alkali production • Products • Artisanal, small-scale mining • Coal-fired power facilities • Research on Fate, Transport, Global Cycling • Believe Partnerships will strengthen existing Program, and that progress can be made in short-term to reduce uses and releases
U.S. Involvement - Partnerships • Each partnership will be unique because of the variation of sources, different issues, etc…, but in general, partnerships could include some or all of the following: • Sharing information about best management practices and appropriate technologies • Demonstration projects • Leveraging Resources • Data collection and reporting • Training and Workshops • Outreach and Education • Other activities with an aim to reduce uses and releases, etc…
Partnerships • Stakeholders are invited to participate • A “partner is an entity who indicates a willingness to contribute time, resources, or expertise to implement the partnership…”
U.S. Hosting Informal Consultations to Further Discuss & Develop Partnerships • May 25, from 2:00 to 5:00, at the Eastland Park Hotel, in Portland, Maine • Mercury Reduction in Products • Contact: Denise Wright (U.S. EPA) • Mercury Reduction in Chlor-alkali Sector • Contact: Angela Bandemehr (U.S. EPA) • June 15, from 1:00 to 5:30, at World Bank, in Washington D.C. • Mercury Management in Artisanal and Small-scale Gold Mining • Contact: Marianne Bailey (U.S. EPA)
For More Information • See UNEP Mercury website: • www.chem.unep.ch/mercury/
Presentations May 23 – 25, 2005 Portland, Maine
Mercury Product Life-Cycle Tool: Uses and Results Alexis Cain, US Environmental Protection Agency, Region 5 Achieving Mercury Reductions in Products and Wastes, Portland, ME, May 23, 2005
Questions • Are Products (Still) Important Sources of Mercury to the Environment? • Incinerators have been controlled • Mercury thermometers have become rare • Which Products Contribute the Most? • Which Pathways Contribute the Most? • Which Interventions Will Reduce Mercury the Most?
Mercury Product Life-Cycle Release Estimation Project • Minnesota PCA (Ed Swain)/Barr Engineering (Carol Andrews, Bruce Monson)– estimates for MN in 2001– Used to improve MPCA mercury emissions inventories • Wisconsin DNR/Barr/Dane County– adapted for WI in 2003-2004 • 2004-5; EPA Region 5, WDNR (Randy Case), Dane Co. (John Reindl), Barr (Cliff Twaroski, Sarah Disch) develop national estimates
Life-Cycle Mercury Flow Approach • Mass Balance • Spreadsheets • Distribution Factors • Release Factors • Estimated releases to air, water, land in 1990, 2000, 2005-10 • Mercury used in products is released, recycled, or maintained in inventory
Products Covered • Dental amalgam • Fluorescent lamps, other lamps • Bulk liquid mercury • Switches and relays • Auto switches • Thermostats • Measurement and Control Devices • Thermometers • Batteries– a back of the envelope analysis • Did not evaluate chemicals, fungicides
Emissions by Pathway: 2005 Total: 24.3 metric tons
Selected 1999 NEI* Emissions Compared with Model (2000) NEI: EPA’s National Emissions Inventory. Steel furnace estimate from regulation development for foundries and electric arc furnaces.
Iron and Steel Recycling • Less decrease than in most other categories • Not just autos– autos account for under 1/2 of steel furnace emissions (high uncertainty) • Not just steel furnaces– zinc production, shredders, auto fluff
Solid Waste Management System • Emissions declining rapidly • Big impacts from battery P2; incinerator regulations • Emissions could be significant for: • Burn barrels • Product breakage during use, transport to disposal sites • High uncertainty
Dental Amalgam • Significant water releases (495 kg in 2000) >50% • Air releases from sludge incineration and land application, dental office vacuum system, cremation, exhaled air (high uncertainty) • Potential BMP/Separator impact?
Evaluation of Potential Control Options: Dental Amalgam, 2005 In kg. Assumes that WWTPs are equally effective at removing dental amalgam and other mercury from sewage.
Evaluation of Potential Control Options—Air Emissions Impact • Auto switches, 2005 • 0 switch removal– 5,050 kg emissions • 20% removal– 4,090 kg • 80% recycling—1,211 kg • Fluorescent lamps, 2005 • 25% lamp recycling—1,142 kg emissions • 75% lamp recycling– 599 kg emissions
Conclusions • Products Are Still Important Sources of Mercury to the Environment • Releases reduced significantly • Important reduction opportunities in iron and steel production/recycling; dental, lamps • Model provides opportunity to better understand release pathways and to test impact of potential control strategies • Quantification is rough—many uncertainties • More detail on the model: Wednesday, 5/25
Questions? • Alexis Cain USEPA-Region 5 (312) 886-7018 cain.alexis@epa.gov
Presentations May 23 – 25, 2005 Portland, Maine
Mercury Pollution in the Northeast: Sources, Impacts and Role of Mercury Products C. Mark Smith, PhD MS Massachusetts Department of Environmental Protection/ CoChair NEG-ECP Mercury Task Force
Credits • Inventory: Margaret Round, NESCAUM; state air program staff • Deposition modeling: John Graham; Jung-Hun Woo; Emily Savelli (NESCAUM) • Deposition monitoring: Gerald Keeler (U. Michigan); Margaret Round (NESCAUM); Thomas McGrath and Air Assessment Branch staff (MADEP) • Fish monitoring: Michael Hutcheson; Carol Rowan West, Jane Rose; Kenneth Hulme; Barbara Eddy; Oscar Pancorbo; Chi-ying Hsieh; Robert Maietta; Gregory DeCesare (MADEP) Normandeau Associates staff. • Costs: Praveen Amar (NESCAUM); James Hammitt (HCRA); Glenn Rice (EPA)
1. Many Waterbodies Impacted In MA > 60% of lakes tested; statewide advisory; over 100 waterbodies with specific advisories. C. Mark Smith PhD, MS. 2003.
2. Many Children at Risk Based on CDC data 84,000 newborns each year at risk in the northeast C. Mark Smith PhD, MS. 2003.
3. Wildlife At Risk Fish eating birds, even some songbirds Fish Eating Mammals C. Mark Smith PhD, MS. 2003.
4. Mercury Health Costs Significant • Mt. Sinai School of Medicine Mercury Health Cost Study (2005) • Harvard Center for Risk Analysis NESCAUM Mercury Reduction Health Benefit Study (2005)
Mt. Sinai School of Medicine Mercury Health Cost Study (2005) • Economic costs from mercury exposure from all sources/ utility emissions • Health effects considered: • Neurotoxicity (decreased IQ) in children • Other health/ environmental impacts not considered • Anthropogenic mercury costs for all sources: $2,200,000,000 – $43,800,000,000 per year. • NE costs: $293,000,000 – $5,835,000,000 per year • Costs per pound of mercury pollution (based on utility emissions): $13,000 (range: $1,000 - $66,000)
Harvard Center for Risk Analysis NESCAUM Mercury Health Benefit Study (2005) • Health benefits associated from 68,000 lb. reduction in emissions attributable to EPA’s utility rule. • Health effects considered: • Neurotoxicity in children (IQ); cardiovascular impacts in adults • Other health effects/ environmental costs not considered. • Benefit estimate: • $100,000,000 to $5,000,000,000 per year; • $1,500 to $74,000 per pound of mercury emissions prevented.