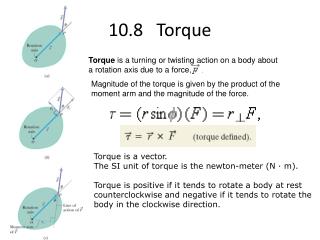
Section 10.8
Section 10.8. Graphs of Polar Equations. Types of Polar Graphs. 1. Circle with center not at the pole. 2. Limaçon with and without a loop. 3. Cardioid. Ways to Graph. Making a table of values. Using symmetry. Finding the maximum value of r . Finding the zeroes. Using a Table.

Section 10.8
E N D
Presentation Transcript
Section 10.8 Graphs of Polar Equations
1. Circle with center not at the pole. 2. Limaçon with and without a loop. 3. Cardioid
Making a table of values. Using symmetry. Finding the maximum value of r. Finding the zeroes.
When the polar equation is of the form: r = a cos or r = a sin The graph is a circlewhose center is on the x-axis for cosine graphs and on the y-axis for sine graphs. The diameter of the circle is determined by a.
Let’s start from the beginning with a table to graph a curve. Graph r = 6cos θ using a table. Let’s graph these points on a polar graph.
There are three types of symmetry that are used to graph on the polar coordinate system.
(r, θ) (r, − )
(r, θ) (r, -)
(r, θ) (r, + )
When the polar equation is of the form: r = a ± bcos or r = a ± b sin (a > 0, b > 0) The graph is a limaçon. If a < b, the limaçon has an inner loop. If a = b, the limaçon is a cardioid (heart-shaped) If a > b, the limaçon looks like a lima bean.
Example 1 A limaçon with a loop
Use symmetry to sketch the graph r = 2 + 4sin Since this is a sine graph, we will only look at points in the 1st and 4th quad. and then use symmetry.
Now we will use symmetry to find points in the 2nd and 3rd quadrants. Then draw the graph.
Example 2 A Cardioid
Use symmetry to sketch the graph r = 2 + 2cos Since this is a sine graph, we will only look at points in the 1st and 2nd quad. and then use symmetry.
Now we will use symmetry to find points in the 3rd and 4th quadrants. Then draw the graph.
Example 2 A limaçon without a loop
Use symmetry to sketch the graph r = 4 − 2cos Since this is a sine graph, we will only look at points in the 1st and 2nd quad. and then use symmetry.
Now we will use symmetry to find points in the 3rd and 4th quadrants. Then draw the graph.
When the polar equation is of the form: r = a cos (n) or r = a sin (n) The graph is a rose curve. If n is an odd number, then there are n petals on the rose and the petals are 2 divided by n apart.
If n is an even number, then there are 2n petals on the rose and the petals are 2 divided by 2n apart. The length of the petal is a units.
In previous math courses as well as Pre- Calculus you have learned how to graph on the rectangular coordinate system. You first learned how to graph using a table. Then you learned how to use intercepts, symmetry, asymptotes, periods, and shifts to help you graph. Graphing on the polar coordinate system will be done similarly.
Graph r = 4cos 2 This graph is symmetric to the polar axis. To graph this rose curve we are going to use another aid for graphing. This aid is finding the maximum value |r|and the zeroes of the graph.
To find the maximum value of |r| we must find the |r| when our trig function is equal to 1. In this example cos 2 = 1 2 = 0, 2 = 0,
So our maximum value of |r| is r = 4cos 2(0) r = 4 (4, 0) r = 4cos 2() r = 4 (4, )
Where is cosine equal to 0? /2 or 3/2 So 2θ = /2, 3/2, 5/2, 7/2 and θ = /4, 3/4, 5/4, 7/4 The zero points are (0, /4), (0, 3/4), (0, 5/4), and (0, 7/4).
How many petals are in this rose curve? 4 petals How far apart are each petal? 2/4 = /2 apart What are the coordinates of the tips of the petals? (4, 0), (4, /2), (4, ), and (4, 3/2)
b. Graph r = 5 sin 3θ Find the maximum value of |r|. This is where sin 3θ = 1.
Where is sine equal to 0? 0 or So 3θ = 0, , 2, 3, 4, 5 and θ = 0, /3, 2/3, , 4/3, 5/3 The zero points are (0, 0), (0, /3), (0, 2/3), (0, ), (0, 4/3), and (0, 5/3).