Class 10.1: Tables and Graphs within Excel
450 likes | 577 Vues
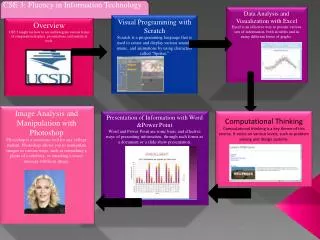
In this course, you will learn to effectively utilize tables and graphs in Excel as powerful problem-solving tools. We will cover various types of graphs and scales, allowing you to visually represent data for better insights. Gain hands-on experience in preparing professional graphs in Excel and learn how to edit these visuals for clarity and impact. By the end of this course, you'll be equipped to analyze data graphically and enhance your decision-making process.

Class 10.1: Tables and Graphs within Excel
E N D
Presentation Transcript
1. Class 10.1: Tables and Graphs within Excel Solving Problems Using
Graphical Analysis
2. Learning Objectives Learn to use tables and graphs as problem solving tools
Learn and apply different types of graphs and scales
Prepare graphs in Excel
Be able to edit graphs