SAMPLING, SAMPLING DISTRIBUTION & CONFIDENCE INTERVAL
Presented By Abid Nawaz Merani Nida Sohail Farzah Siddiqui Soaiyba Jabeen Ahmed. SAMPLING, SAMPLING DISTRIBUTION & CONFIDENCE INTERVAL. Given By: F ARZAH S IDDIQUI. INTRODUCTION. SAMPLING :-. The process of selecting a small part from a large collection,

SAMPLING, SAMPLING DISTRIBUTION & CONFIDENCE INTERVAL
E N D
Presentation Transcript
Presented By Abid Nawaz Merani Nida Sohail FarzahSiddiqui Soaiyba Jabeen Ahmed SAMPLING, SAMPLING DISTRIBUTION & CONFIDENCE INTERVAL
Given By: FARZAH SIDDIQUI INTRODUCTION
SAMPLING :- The process of selecting a small part from a large collection, such that the selected part will show all the characteristics of the large collection is called Sampling. SHORT EXPLANATION :- Sampling is quite often used in our day-to-day practical life. For Example, in a shop we assess the quality of rice, sugar and any other commodity by taking a handful of it from the large and then decide to purchase it or not. ADVANCE BUSINESS STATISTICS
ADVANTAGES OF SAMPLING :- • Sampling method is cheaper to collect information as compared to census (i.e. complete enumeration). • The data may be collected, classified and analyzed much more quickly with a sample than with a census enquiry. • A sample is often used as a check to verify the accuracy of complete count. • It provides greater accuracy because the volume of work is reduced in the sample survey. ADVANCE BUSINESS STATISTICS
POPULATION :- A population may be defined as the large collection of similar units. The number of units in the population (i.e. size of a population) is always denoted by “N”. SAMPLE :- A small part of a population is called Sample. The number of units in the sample (i.e. size of a sample) is always denoted by “n”. ADVANCE BUSINESS STATISTICS
PARAMETER :- Any quantity calculated from a population is called a Parameter. For example, population mean, population variance, etc. are therefore parameters. The population mean is denoted by µ and the population variance is denoted by σ². ADVANCE BUSINESS STATISTICS
STATISTIC :- Any characteristics estimate from a sample is called Statistic. For example, sample mean, sample variance, etc. are therefore statistic. The sample mean is denoted by x and the sample variance is denoted by s². ADVANCE BUSINESS STATISTICS
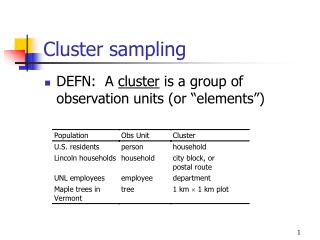
SAMPLING DISTRIBUTION Consider all possible samples of size n which can be drawn from a given population. For each sample we can compute a statistic. Which will vary from sample to sample. In this way we obtain a distribution of the statistic which is called its sampling distribution. ADVANCE BUSINESS STATISTICS
Explained By: NIDA SOHAIL QUESTION ON SAMPLING
QUESTION :- Following is the data of Wickets taken by an AustralianBowler “Bret Lee” in his recent 5 matches against India. Wickets : 3, 0, 1, 2, 4 Required: • Draw a sample size n = 2. • Find all the sample means. • Find the mean of sample means. • Find population mean. ADVANCE BUSINESS STATISTICS
FINDING POSSIBLE SAMPLES :- N n 5 2 5 2 ADVANCE BUSINESS STATISTICS
FINDING SAMPLE SIZE :- ADVANCE BUSINESS STATISTICS
FINDING SAMPLE MEANS :- ADVANCE BUSINESS STATISTICS
FINDING MEAN OF SAMPLE MEANs :- Where, X = Mean of Sample Means X = 2 ADVANCE BUSINESS STATISTICS
FINDING POPULATION MEAN :- Where, • µ = Population Mean • x1 = 3 • x2= 0 • x3= 1 • x4= 2 • x5= 4 • N = No. of Observations of the Population µ = 2 ADVANCE BUSINESS STATISTICS
Explained By: SOAIYBA JABEEN AHMED Confidence interval
ESTIMATION :- Estimation means to determine the unknown value of a population parameter by the help of sample data. FOR EXAMPLE :- Let 2, 4, 6, 8, 10 are the sample observations then x = 2 + 4 + 6 + 8 + 10 5 ADVANCE BUSINESS STATISTICS
x = 6 Where 6 is an estimate where as the statistic Xused as formula is called an estimator. The statistic X is said to be an unbiased estimator when the mean of all possible X is equal to the population mean µ. ADVANCED BUSINESS STATISTICS
CONFIDENCE INTERVAL :- A confidence -interval estimate of a parameter consist of an interval of numbers obtained from a point estimate of the parameter together with a percentage that specifies how confident we are that the parameter lies in the interval. The confidence percentage is called confidence level. It is abbreviated by CI. ADVANCE BUSINESS STATISTICS
QUESTION :- The data of Cholesterol Levelof 100 Individuals belonging to the age group between 20 to 40 years that prefer Junk Food, is collected from a Heart Disease Hospital situated in Federal B. Area, has the Population Mean “µ”168.65 and Standard Deviation “σ”28.56,is: ADVANCE BUSINESS STATISTICS
DATA :- ADVANCE BUSINESS STATISTICS
REQUIRED :- • Draw a sample of size n = 10 from the data. • Construct a 95% confidence interval for population parameter µ. ADVANCE BUSINESS STATISTICS
SOLUTION :- FORMULA FOR CALCULATING CONFIDENCE INTERVAL < µ < Lower Limit Upper Limit ADVANCE BUSINESS STATISTICS
Where, x = Sample Mean σ = Population Standard Deviation n = Sample Size (1 – α) = Co-efficient of Confidence Interval ADVANCE BUSINESS STATISTICS
FURTHER EXPLAINED By: ABID NAWAZ MERANI Confidence interval
CONDITION FOR APPLYING FORMULA :- Before solving the question we have to check the following conditions, if any one of these conditions are fulfilled then we apply the formula. The conditions are: Condition # 1 :- • Population normal. • Sample size n ≥ 30. • Population σ unknown. ADVANCE BUSINESS STATISTICS
Condition # 2 :- • Population normal • Sample size n < 30 • Population σ known Condition # 3 :- • Population normal • Sample size n > 30 • Population σ unknown ADVANCE BUSINESS STATISTICS
FINDING α :- 1 - α = 95% α = 1 – 0.95 α = 0.05 FINDING Zα/2 :- Zα/2 = Z0.05/2 Zα/2 = Z0.025 (From the Z-Table) Zα/2 = - 1.96 ADVANCE BUSINESS STATISTICS
FINDING X :- ADVANCE BUSINESS STATISTICS
RANDOM SAMPLE :- ADVANCE BUSINESS STATISTICS
FINDING SAMPLE MEAN X :- X = ∑X n X = 1700 10 X = 170 ADVANCE BUSINESS STATISTICS
FINDING CONFIDENCE INTERVAL :- Now we have, X = 170 σ = 28.56 Zα/2 = -1.96 n = 10 By using the formula, < µ < ADVANCE BUSINESS STATISTICS
By putting the values in the formula, 158.49 < 168.65 < 181.50 ADVANCE BUSINESS STATISTICS
CONCLUSION :- Just as the Population Mean of 100 individuals lies between the Confidence Interval computed by taking the Sample of 10 observations from the given Population, the Population Mean of thousands of individuals also lies between the Confidence Interval if we take 100 observations as a Sample of that data. ADVANCE BUSINESS STATISTICS
Statistics is a logical subject and we are really proud to be the part of sixty seven logical minds.Thank you so much for your generosity, support, attention and for maintaining discipline in our Presentation.