Download
1 / 14
140 likes | 246 Vues
Investigating NADW components coherence using CFCs & SF6 tracers, indicating pathways & formation rates, essential for understanding MOC dynamics.

E N D
SMOC Brazil 2010 Monitoring the Formation Rate of NADW Components Using Tracer Inventories Rana A. Fine Rosenstiel School, University of Miami Studies show little to no meridional coherence in MOC across gyre boundaries (Dengler et al., Nature, 2004; Bingham et al. GRL, 2007). South Atlantic is a major region for water mass transformation for the compensating MOC flows. Proposing to use CFCs & SF6 to look at coherence for AAIW and NADW between their source regions and the southwestern Atlantic.
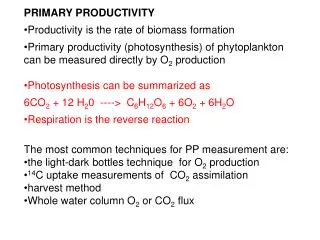
Atmospheric time histories of CFCs, SF6Total amount of CFCs and SF6 present in subsurface water mass is directly related to the rate of its conversion from surface water. We are now routinely measuring both CFCs and SF6. Even though CFCs decreasing in atm, presently get excellent ratio age using SF6:CFC. Data from ALE/GAGE network
1994 NADW AAIW Highest CFC inv (and CO2) due to MOC: downstream of NADW formation,NADW is ~50% of Atlantic inventory to 10°S; other high (40-60°S) is related to formation of Mode and Antarctic Intermediate Water Willey, Fine, et al., GRL, 2004
CFC-11 inventory in AAIW from data: Maxima in SE Pacific and SW Atlantic (Lachkar et al. DSR 2009)
NADW component of MOC 60N 1997-98 DWBC 24.5N Smethie et al., AGU Monogr., 2007
NADW: ULSW CLSW MNADW/ ISOW LNADW/ DSOW Maximum CFC-11 in DWBC. Build up over time shows CLSW spreads from its source to subtropics in ~10 years, after spending time in recirculation gyres and eddies.Updated fromMolinari, Fine et al., GRL, 1998
LNADW UNADW CFC ages: giving information about storage and effective spreading rates of MOC components Fine et al., GRL, 2002
1993 Section along 30°S Brazil Basin shows highest CFCs in NADW along western boundary (& Bottom Water), also patchiness of elevated CFCs in interior. (No CFCs available from 2003 section.) Proposing to measure CFCs & SF6 every other year on CTD cruises servicing IES etc over western boundary and when possible entire Brazil Basin. Is the DWBC re-constituted again at 30S? What is the relationship of western boundary NADW in Brazil Basin to upstream?
Monitoring using CFCs & SF6: Independent tracers that are sensitive indicators to be used to quantify formation rates and variations in the NADW and SAMW/AAIW components. Provide information on coherence between high latitude source regions and regions downstream- via western boundary and interior pathways. Though the total rate of formation of NADW may not have changed in past few decades, there maybe changes in its individual components. Decreases in production of CLSW may be offset by increases in ULSW, vice versa.In contrast, percentage contributions to DSOW change, but no evidence for a long term trend in DSOW transport. Important to monitor more than the total NADW/AAIW rate- need to monitor individual water mass components to understand system dynamics- can impact heat, freshwater, CO2 fluxes.