Lecture 1 Gene Expression
Lecture 1 Gene Expression. Review of three types of gene expression technology. Present examples of gene expression studies in plants. Oil content of Illinois long term selection lines. Economic potential of IHO. The major use of high oil corn is for animal feed.

Lecture 1 Gene Expression
E N D
Presentation Transcript
Lecture 1 Gene Expression • Review of three types of gene expression technology. • Present examples of gene expression studies in plants.
Economic potential of IHO The major use of high oil corn is for animal feed. Using 1990 numbers, it is estimated that 10 million hectares would be needed to grow the feed for consumption by US poultry, swine, sheep & cattle. 8 million bags of hybrid seed would be needed to sow these fields (this represents 40% of the estimated hybrid corn seed bags produced in 1990). The long-term premium value for high oil corn may be $0.20/bushel (this would generate an incremental value of $820 million per year).
Specialty corn - Enhanced oil • Oil has 2.25 times the feed energy of starch - increases animal growth • Value-added to producers and exporters • Increased oleic acid content (18:1 / 18:2) - less prone to oxidation and rancidity - tolerates higher cooking temperatures - health benefits
Expressed sequence tag (EST) • An EST is a single pass sequence read from a randomly selected cDNA clone. • A comprehensive survey of the genes in an organism requires many different cDNA libraries. • ESTs can be assembled into “contigs” by aligning sequence traces with the Phred/Phrap/Consed program suite. • ESTs that do not align with a contig are called singletons. • The progress of an EST project can be tracked by the % of ESTs that fall into contigs. • A “unigene” set consists of a representative clone from each of these contigs. • ESTs can be compared to other sequences using the Blast program.
Genomics based strategy to identify genes coding for secondary metabolites. A combination of DNA microarray based expression analysis and EST sequencing is used to identify candidate genes that are to be tested in transgenic plants.
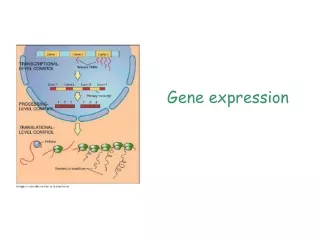
Gene expression analysis methods • Hybridization of complex cDNA probes to DNA microarray. • Capture signature sequences from 3’end of cDNAs using traditional DNA sequencers and typeIIs enzymes. • Capture signature sequences by sorting cDNAs on beads and solid phase sequencing with typeIIs enzymes. • Capture signature signature sequences off PCR colonies (a.k.a., polonies) by in-situ sequencing. RE C O G N I T I O N N8N7N6N5N4N3N2N1 S E Q U E N C E N8N7N6N5N4N3N2N1
Scatter plots from Schenk et al. (2000) PNAS vol. 97: 11655–11660 1 2 Scatter plot graphs of expression distribution patterns of 2375 ESTs after microarray hybridizations with: 1) A negative control with two untreated control samples, 2) inoculation with A. brassicicola, applications of 3) SA, 4) MJ, and 5) ethylene (Eth). Diagonal red lines represent 2-fold and 3-fold inductionyrepression ratio cutoffs relative to the best fit line through the normalized data (middle green line). 4 5
Gene expression analysis methods • Hybridization of complex cDNA probes to DNA microarray. • Capture signature sequences from 3’end of cDNAs using traditional DNA sequencers and typeIIs enzymes. • Capture signature sequences by sorting cDNAs on beads and solid phase sequencing with typeIIs enzymes. • Capture signature signature sequences off PCR colonies (a.k.a., polonies) by in-situ sequencing. RE C O G N I T I O N N8N7N6N5N4N3N2N1 S E Q U E N C E N8N7N6N5N4N3N2N1
Serial Analysis of Gene Expression (SAGE) A small tag is isolated from cDNA 3’ends using a typeIIs enzyme. The small tags are concatemerized and sequenced. The signatures from the library are compared to signatures extracted from the genome sequence and EST data. The relative frequency of the tags is a measure of the level of the mRNAs from which they came.
B CATG AAAA TTTT BIO ADAPTER“A” CATG TAG#1 AAAA ADAPTER“B” CATG TAG#2 AAAA GTAC GTAC BsmFI cut 14 bp BsmFI cut 14 bp CATG TAG#2 ADAPTER“B” CATG TAG#1 ADAPTER“A” GTAC CATG TAG#1 ADAPTER“A” CATG TAG#2 ADAPTER“B” CATG TAG#1 ADAPTER“A” TAG#2 CATG ADAPTER”B” TAG#4 TAG#3 TAG#1 TAG#2 TAG#5 TAG#6 TAG#4 TAG#3 TAG#1 TAG#2 TAG#5 TAG#6 CATGCGATGCTTCGAATGCGGTAACATGACTAGATGCTTAGCTTGGATCATGCTGATGCAACCGTAGCTTTACATG Legend by Dr. B. Lemieux
Current Experiments • 3’and 5’ RACE (Rapid Amplification of cDNA Ends) • - identify the candidate genes and to create a SAGE database utility • - obtain the full sequence of EST • Mapping and QTL Analysis
Molecular genetics of wax biosynthesis • We are also using Arabidopsis as a model system to study lipid biosynthesis. • Plants with mutant alleles of epicuticular wax biosynthesis genes have a visible phenotype (see picture) • We have isolated clones of 3 “CER” genes regulating wax deposition using “forward genetics” • One of these genes (CER3) is the focus of our program.
CER3 is expressed in flowers, fertilized pistil and embryos • In situ hybridization of antisense CER3 probes to developing flowers (top), fertilized pistil (middle) (and mature seed (bottom). • The CER3 sense control probe gives no signal in seeds (bottom right)
Using 8, 4-mer words a set of 32-mer tags was produced. Brenner et al (2000) Proc Natl Acad Sci USA vol. 97 no. 4 pp 1665–1670
Preparation of the cDNAs before immobilization to the beads. Tag complementary sequences are synthesized with a Bsp1201 and PacI site. These adapters are cloned into a plasmid vector. The 3’end of cDNAs are cloned into the vector. PCR with a FAM-labeled primer is used to make fluorescent labeled molecules. The products are cut with PacI and the hybridization tag exposed by the nicking enzyme Bsp1201. The beads capture these fluorescent DNAs and can be separated by flow cytometry.
Competitive loading experiment with different ratios of R110 or Cy5
Mass Parallel Signature Sequencing (MPSS) technology GCTG ATGC TAGC TAGC CTAT CGCG ACTA CTCG Immobilize 32-mer anti-tags Clone 32-mer tags Make cDNA Make cDNA library (attach one cDNA/tag) Hybridize to tags Pack beads in fluidics station Solid phase sequence with 15-mer hybridization tags & typeIIs digestions Image beads after hybridizations with tags
Solid Phase Sequencing method used in MPSS technology Cut & ligate adapter1 N8N7N6N5N4N3N2N1 N8N7N6N5N4N3N2N1 N8N7N6N5N4N3N2N1 N8N7N6N5N4N3N2N1 N8N7N6N5N4N3N2N1 N8N7N6N5N4N3N2N1 N8N7N6N5N4N3N2N1 N8N7N6N5N4N3N2N1 N8N7N6N5N4N3N2N1 N8N7N6N5N4N3N2N1 Cut with TypeIIs enzyme N8N7N6N5N4N3N2N1 N8N7N6N5N4N3N2N1 N8N7N6N5N4N3N2N1 N8N7N6N5N4N3N2N1 N8N7N6N5N4N3N2N1 N8N7N6N5N4N3N2N1 N8N7N6N5N4N3N2N1 N8N7N6N5N4N3N2N1 N8N7N6N5N4N3N2N1 N8N7N6N5N4N3N2N1 Ligate adapter with 15-mer hybridization tag N8N7N6N5N4N3N2N1 N8N7N6N5N4N3N2N1 N8N7N6N5N4N3N2N1 N8N7N6N5N4N3N2N1 N8N7N6N5N4N3N2N1 N8N7N6N5N4N3N2N1 N8N7N6N5N4N3N2N1 N8N7N6N5N4N3N2N1 N8N7N6N5N4N3N2N1 N8N7N6N5N4N3N2N1 Hybridize 15-mer anti-tag probes Digestion, Ligation & hybridization cycle Digestion, Ligation & hybridization cycle
Photo bleach In-situ sequencing TGGACG N1N2N3N4N5N6N7N8 C TGGACG N1N2N3N4 N5N6N7N8 TGGACGN1N2N3N4 N5N6N7N8 A Polony amplify Pour slides & TGGACG N1N2N3N4 N5N6N7N8 TGGACGN1N2N3N4 N5N6N7N8 A TGGACGN1N2N3N4N5N6N7N8 T Polony in-situ sequencing Mitra et al. (1999) Nucleic Acids Res 27: e 34 Make cDNA Ligate adapters
SNP Discovery using the SNPfinder program SNP AI833858 lib605(Ohio43) AACTTATTGTTACGTCACATCGTTTTGACATGCTGCGGTGCTATAATGCTTCTACTGCAT AW600454 lib660(Ohio43) AACTTATTGTTACGTCACATCGTTTTGACATGCTGCGGTGCTATAATGCTTCTACTGCAT AI947613 lib603(B73) AACTTATTGTTACGTCACATCGTTTTGCCATGCTGCGGTGCTATAATGCTTCTACTGCAT AI855193 lib603(B73) AACTTATTGTTACGTCACATCGTTTTGCCATGCTGCGGTGCTATAATGCTTCTACTGCAT AI649414 lib603(B73) AACTTATTGTTACGTCACATCGTTTTGCCATGCTGCGGTGCTATAATGCTTCTACTGCAT AW066661 lib683(B73) AACTTATTAGTACGTCACATCGTTTTGCCATGCTGCGGTGCTATAATGCTTCTACTGCAT Ai691711 lib606(Ohio43) AACTTATTGGTACGTCACATCGTTTTGACATGCTGCGGTGCTATAATGCTTCTACTGCAT ******** ***************** ******************************** Bad Basecall
Genotyping single nucleotide polymorphisms • Hybridization to custom oligonucleotide arrays • Universal DNA array based assay • Pyrosequencing of SNP haplotypes
Genotyping results A set of 8 SNPs are genotyped by the “barcode” OLA. Each allele of a locus occupies a different subarray. The predicted genotypes, obtained from sequencing PCR products, are given below:
Single base extension on a DNA microarray Immobilized oligonucleotides are extended by a single nucleotide to re-sequence a DNA template (shown in gray). These oligonucleotides can be selected using the “tiling” path approach to obtain DNA sequence of a region or can be selected to assay a given SNP locus. Dye-labeled dideoxy-terminators are used for these single base extension reactions. The reaction products are detected by scanning the microarray in the 4 channels. Mispriming by polymerase is the largest source of error with this method.
SBE-TAGS: An array-based method for efficient single- nucleotide polymorphism genotyping Hirschhornet al. 2000 PNAS 97: 12164–12169 A SNP is detected by single base extension reactions Dye-labeled dideoxy-terminators are used for these single base extension reactions. The substrate oligos have a hybridization tag that directs the reaction products to a specific address on the array. These products are detected by scanning the microarray in the 4 channels. Mispriming by polymerase is the largest source of error with this method.
Genotyping with oligonucleotide microarrays • DNA sequence around a single nucleotide polymorphism (SNP) is used to design a “tiling pattern” on the DNA chip. • This DNA sequence is also used to design primers for PCR amplification of the SNP. • SNP markers can be PCR amplified in pools (a.k.a., multiplex PCR). • These PCR amplification products are labeled in a second round of PCR. • The labeled amplicons are pooled and hybridized to the chip.
The tiling path concept • A sequence (indicated by the green line) is used to design a tiling path for the DNA chip. • The oligos (blue lines) are complementary to the target sequence. • Mismatches are placed in the center of the oligos to maximize their impact on the hybridization reaction.
For SNP genotyping two variant detector arrays are used The variant detector for the “A” allele of the SNP is the top detection block while that for the “C” allele is the bottom block. Note, the reduced signal of the A/A in the bottom block. Wang et al (1998) SCIENCEVOL. 280 :1077-1082