Download
1 / 47
470 likes | 482 Vues
Learn about the recommendations for improving the reverse supply chain, reducing damage, unsaleables, and returns. Discover insights from industry experts and case studies on successful cost reduction strategies.

E N D
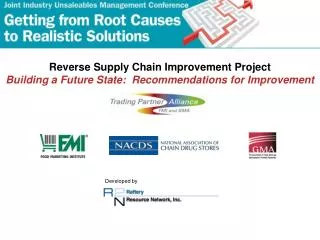
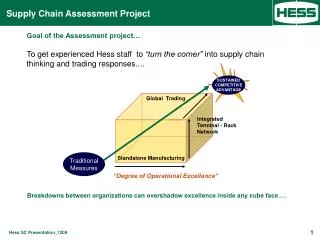
Reducing Damage, Unsaleables and Returns Excerpts from: Reverse Supply Chain Improvement Project Building a Future State: Recommendations for Improvement Wednesday 10:45 to 11:45 Sponsors & Publishers Developer
Today’s Presenters Dan Raftery, Raftery Resource Network Jim Schumacher, Pfizer Consumer Healthcare Ted Lechner, HEB Grocery Company Bob Rippley, Associated Wholesalers Inc. Pete Bannochie, DRS Product Returns Formerly with General Mills
Today’s Topics Top-level summary of the project Damaged Products Learnings Expired Products Learnings
Project Goals Develop recommendations for improving the reverse supply chain that include distribution, business and financial practices. Develop recommendations for increasing the likelihood that retailers, wholesalers, manufacturers and service providers will implement the improvement recommendations.
Project Concept Phase 1: Defining Current State (Fact-Finding) Perspectives & Practices Survey 49 companies Data Survey Policy Survey 34 companies 12 companies 20 companies Case Studies & Incentives Interviews 25 companies Senior Executive Summit 1/12/11 Phase 2: Building a Future State 18 companies Recommendations & Communications 58 companies participated in this project.
Industry Report Contents Executive Summary Industry conditions & major issues Perspectives & Practices Survey Qualitative findings & conclusions Data Survey Quantitative information Policy Survey “Snapshot” of damaged & expired policies Incentives & Efficiencies Interviews Opinions & ideas for improvement “Best Practice” Case Studies Real world successes in reducing costs http://www.fmi.org/docs/supply/fmi_reverse_sc_improvement.pdf#search="reverse supply chain improvement“
1. Keep the five topics separate General Recommendations - selected Source: Senior Executive Roundtable Summit Internal and trading partner discussions will be more productive. • Across the five topics, issues and opportunities vary by company, by product category and often by brand. • The current level of industry discord on the combined subject of unsaleables is driven, in part, by these variations. • By focusing on the conditions individually, companies can be more successful in identifying and making improvements.
2. Enhance scorecards and internal performance reports General Recommendations - selected Source: Senior Executive Roundtable Summit Add metrics and Key Performance Indicators (KPIs) for each condition. • Scorecards can be used internally among corporate divisions and with trading partners. • KPIs can be used in internal performance incentive programs and in industry-level comparative assessments such as “best-in-class” publications.
RSCI Implementation Work Groups 54 people 41 companies GENCO ATC General Mills, Inc. Harris Teeter, Inc. HEB Grocery Company Heinz North America Inmar Kellogg Company Kraft Foods, Inc. The Kroger Company Land O’Lakes, Inc. Mars Chocolate North America Nash Finch Company, Inc. Nestle Purina PetCare Co Nestle USA, Inc. Pfizer Consumer Healthcare Pharmavite, LLC The Procter & Gamble Co. Rite Aid Corp. S.C. Johnson & Son, Inc. Spartan Stores, Inc. Stericycle Pharmaceutical Services Strategic Solutions, Inc. Unilever US Wakefern Food Corp. Walgreen Company Welch Foods, Inc. Winn-Dixie Stores, Inc. Alberto-Culver Company Associated Wholesalers, Inc. Bozzuto’s, Inc. C&S Wholesale Grocers, Inc. Campbell Soup Company Church & Dwight Co., Inc. The Clorox Company Coca-Cola North America ConAgra Foods Del Monte Foods Company Delhaize America DRS Product Returns LLC Energizer Personal Care Feeding America 11
Project Concept - 2011 RSC Implementation Work Groups Mfr Disco Rtl/Whlr Disco Recalls Damaged Expired
Reverse Supply Chain Improvement ProjectDamaged Products Work Group Presenters: Jim Schumacher, Pfizer Consumer Healthcare Ted Lechner, HEB Grocery Company The What, Where, How and When of Reducing Damage Within Your Supply Chain JS
Damaged Products Work Group Jim Schumacher (Lead), Pfizer Consumer Healthcare Tom Prestridge, Alberto-Culver Company Jace Swartzendruber, ConAgra Foods Eric Davis, Feeding America Ted Lechner, HEB Food Company, LP Sue Bentel, Nestle Purina PetCare Co Jim Flannery, The Procter & Gamble Co. Donald Aday, Strategic Solutions, Inc. JS
Today’s Topics • Manufacturer supply chain investigation. • Touch points and measures. • Collaborating with data. • Case studies • Retailer/wholesaler supply chain investigations. • Touch points and measures. • Case studies. • Your Call to Action - Best practices for controlling damage. 15 JS
Supply Chain Touch Points Insert flow chart of various touch points (Don Aday) 16 JS
What Should be Measured • Examples include defective parts per million, units per thousand, % of sales, ..etc.. • Choose a measurement that is easily understood and shows the impact of damage reduction efforts 17 JS
Manufacturer Case Study #1 • Pfizer Consumer Healthcare’s (PCH) first study of 2010 showed a spike in case damage rates • PCH used Pareto analysis and the corresponding “80/20 rule” to quantify and prioritize what needed to be addressed • After looking at damage conditions found, we wanted to drill down even further to focus on which plant and product were the drivers 18 JS
Manufacturer Case Study #1 Plant “A” assumed production of the product in question from another plant Root cause of damage – fit of cases was not compatible with Plant A’s pallet specification Specification was updated to provide more deck coverage As a result Plant “A” went from “worst to first” in one year by shipping the least amount of damages in our 2011 study year JS 19
Manufacturer Case Study #2 ConAgra Foods discovered that the board weight of some of their corrugate could not withstand the rigors of the entire supply chain Investment was made to add corrugate and increase board weight Resulted in 70% decrease in damage over 1 year 20 JS
Manufacturer Case Study #3 Nestle Purina pursued options to paper bags which are subject to tears Investment made to migrate packaging on large bags to “Tough” Bag (woven) Significant damage reduction was realized throughout the supply chain Tough Bag is now used for 100% of Conventional Litter and >95% of Dry Pet 65% 52% 21 JS
Retailer/Wholesaler Touch Points Less then full Case shipping CPU Backhaul Product is manufactured at the plant Product received at the DC Product placed in reserve slots Product placed in pick slots Store pallets are built Load pallets onto the trailer Vendor Ship Sold to customer Trailer delivers to the store Pallets are unloaded off the trailer Pallets are down- loaded to Skids Stockers stock product to the shelf Product is on the shelf for purchase Customer Return Unsaleables Product is put into back-stock Sent to DC Sent to RGC 22 TL
Retailer/Wholesaler Case Study #1 Perfect Pallet Program Purpose: A Systematic Approach To Ensure That We Consistently Deliver Fresh, Damage Free, Quality Product To Our Customers At The Lowest Possible Cost • Develop Clear Expectations Of The Perfect Pallet • Improve Training And Coaching For Order Selectors And Loaders • Measure Individual And Facility Performance • Reward Partners Who Create Quality Pallets and Loads • Improve Store Efficiency By Delivering The Most Cost Efficient Shipping Plat Form • Select The Most Efficient Flow Path For The Product 23 TL
Retailer/Wholesaler Case Study #1 Elements Of The Perfect Pallet • Right Product • Right Time – On Time Delivery • Damage Free • Fresh, Quality Product • Lowest Cost ………. 24 TL
Retailer/Wholesaler Case Study #1 Elements of a Perfect Pallet Stacked Properly No Pallet Overhang Damage Free Wrapped: Top to Bottom Slip-Sheets for Bagged Product Labeled Properly 25 TL
Retailer/Wholesaler Case Study #2 Creating a Focus • Branded the program with a catchy theme • Identified High Shrink Categories • Developed cross functional team • Group attack • Warehouse • Store • Transportation • Report out findings and actions • 30, 60 & 90 Day 26 TL
Retailer/Wholesaler Case Study #2 Store Ownership • Store identifies damaged product as • Damage • Refresh/Discontinued • Recall/Merchandise Return • Product is scanned at store level and removed from inventory, SRS is adjusted • Product returned in banana box to RGC • Apply Manufacturers policy (Donate, Return, Destroy, Hazardous Waste, Salvage) • Third Party Generates Vendor invoices for HEB • Data is transmitted to HEB • HEB deducts for non swell vendors • Swell Vendors & Write off’s are not collected TL
Retailer/Wholesaler Case Study #2 Store Ownership • Credit to stores based on Swell allowance • Defective allowance by Sub Department • Stores scan product at store- • Dollars calculated against swell allowance • Dollars scanned over allowance will show up as excess RGC- Reduce gross profit • Dollars scanned under allowance difference will show up as extra credit/increased gross profit TL
Retailer Case Study #2 Partner/Education Awareness • RGC Store Meeting • Include RGC responsibilities in new hire orientation. • Train Center Store Mgrs. to print RGC data. • Share data with partners to communicate progress and opportunity areas. • Manager’s Role: • Communicate program to all partners in their respective departments • Set clear goals and expectations for the program • Execute the program 100% • Be the RGC champion in your store TL
Retailer/Wholesaler Case Study #2 Damage Reduction Plan • Banana Box Program Every overnight stocker will secure a banana box and write their name on it. All damages are to be placed in box and they will not be released until audited by Center Store Mgr. or MIC • Stocker tool belt Every center store partner [daytime and overnight] will be required to carry a tool belt while on duty. It should be considered part of the uniform policy. Contents include: cutter, blades, tape, black marker, peg hole tabs. • Receiver tool box Each wareroom and receiving area will be equipped with tool box to assist in repairing RGC. Every MIC will audit 5 RGC boxes weekly • Utilization of RGC for in-store supplies Use potential RGC [paper towels, toilet paper, etc. for in-store supplies. Transfer of product must be completed daily and to the correct department 1A (supplies TL
Your Call to Action Process The right mix of processes, metrics & collaboration can reduce your damages. JS
Your Call to Action Measurements & Metrics The right mix of processes, metrics & collaboration can reduce your damages. JS
Your Call to Action Collaboration JS The right mix of processes, metrics & collaboration can reduce your damages.
Reverse Supply Chain Improvement Project Expired Products Work Group Presenters: Bob Rippley, Associated Wholesalers Inc. Pete Bannochie, DRS Product Returns Formerly with General Mills BR
Expired Products Work Group Gary M. Piwko (Lead), Kellogg Company Joy Sgro (Lead), Bozzuto’s Chris Michael, AWI Bob Rippley, AWI Don LaChance, C&S Wholesale Grocers Sharon Petrarca, Coca-Cola Refreshment Rob England, Delhaize America Gene Bodenheimer, GENCO ATC Pete Bannochie, General Mills, Inc. George Thrower, Harris Teeter, Inc. Gene Schachte, Heinz North America Mike Umbach, Inmar Bert Kibbler, Kraft Foods, Inc. Rob Shifter, Nestle USA, Inc. Rob Davis, Pfizer Consumer Healthcare Jim Flannery, Procter & Gamble Neil Meischeid, Rite Aid Corp. Francis Wong, Spartan Stores Gary Snyder, Strategic Solutions, Inc. BR
Why This is Important 12 months ending April 2011 2010 Supply Chain Audit Data for 13 manufacturers with combined U.S. sales of over $100 billion. Source: Inmar BR
Why This is Important Source: Inmar Supply Chain Audit Data for 13 manufacturer clients with combined U.S. sales of over $100 billion. BR
Expired Hot Button #1 What is the product life at the time of production, what is guaranteed to retailers/wholesalers and why? “Not knowing is worse than not liking.” – Joy Sgro • Recommendations • Discuss, plan and manage DAYs – not percentages. • Open communication on all dating information that is not confidential. • Reduce gap between production days and guaranteed days. Real examples: • Produced with 1,460 days, guarantee 90 days • Produced with 1,825 days, guarantee 90 days • Collaborate on delivering to consumer days remaining needed for consumer. • Read the 2011 GENCO ATC Product Lifecycle Logistics white paper: “Winning the Expired Products Battle.” 1,3 BR 2,4,5 PB
Expired Hot Button #2 How can we better sell short-coded inventory prior to expiration? • Recommendations • Don’t try to sell into your primary market. • Donate • Secondary markets • Offer a “hot” price to primary customers with capacity to move product. • Fund outside of ARP programs and trade marketing programs. PB
Expired Hot Button #3 How can we reconcile product life cycle with supply chain throughput? • Recommendations • Understand all facets of this complex issue • Reverse engineer the process. How many days are needed at: • Consumer pantry • Store • Retailer/wholesaler DC • Manufacturer DC • Measure your performance • Communicate results with trading partners • Continually improve the process PB
Expired Hot Button #4 How can a manufacturer manage multiple shelf life requirements across customers? Across channels? • Recommendations • Deliver the maximum shelf life available to all customers. • Discuss, plan and manage DAYs – not percentages. • Collaborate with customers routinely to manage this complex issue. Can sales department play a more active role in getting customer needs into manufacturer systems? PB
Expired Hot Button #5 What is the right verbiage to accompany the expiration date? • Verbiage and dates are confusing to all concerned: • Best By, Best if Consumed By, Enjoy By, Sell By, etc, etc. • Produced On, Born On • Just a date, Is this produced on, sell by, use by? • Any sequence you can think of MMM DD YYY, YYYY M D, DD M YYYY…..etc • Recommendations • Go for clean and simple on package versus artistic. • Read the 2003 recommendations and follow them. “Expired Products Project,” Grocery Manufacturers of America, Food Marketing Institute. BR
Score Cards for Days Remaining 2 3 4 1 Retailer or Wholesaler Distribution Center Retail Store Consumer Pantry Manufacturer Distribution Center Goal: Increase the number of Days Remaining for consumers at purchase. By: Increasing Days Remaining at upstream entry points 1 – 3. Decreasing the number of Days of Supply at points 1 – 3 . BR
Top 5 Things That You Can DoTo Increase Days Remaining Manufacturer Scorecard PB
Top 5 Things That You Can DoTo Increase Fresh Days Retailer/Wholesaler Scorecard BR
Why you should use these scorecards • The common language of “Days Remaining” will be easier to understand and put into systems. • A greater focus on Days of Supply will improve inventory turnover. • Increasing industry knowledge about Pantry Life will benefit all, including consumers. 1 PB 2, 3 BR