Download
1 / 9
90 likes | 518 Vues
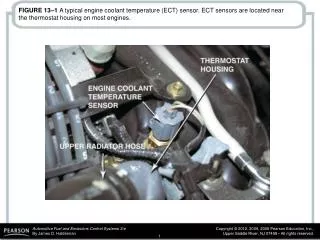
FIGURE 13–1 A typical engine coolant temperature (ECT) sensor. ECT sensors are located near the thermostat housing on most engines. FIGURE 13–2 A typical ECT sensor temperature versus voltage curve.

E N D
FIGURE 13–1 A typical engine coolant temperature (ECT) sensor. ECT sensors are located near the thermostat housing on most engines.
FIGURE 13–2 A typical ECT sensor temperature versus voltage curve.
FIGURE 13–3 A typical two-step ECT circuit showing that when the coolant temperature is low, the PCM applies a 5-volt reference voltage to the ECT sensor through a higher resistance compared to when the temperature is higher.
FIGURE 13–4 The transition between steps usually occurs at a temperature that would not interfere with cold engine starts or the cooling fan operation. In this example, the transition occurs when the sensor voltage is about 1 volt and rises to about 3.6 volts.
FIGURE 13–5 Measuring the resistance of the ECT sensor. The resistance measurement can then be compared with specifications. (Courtesy of Fluke Corporation)
FIGURE 13–6 When the voltage drop reaches approximately 1.20 volts, the PCM turns on a transistor. The transistor connects a 1-kΩ resistor in parallel with the 10-kΩ resistor. Total circuit resistance now drops to around 909 ohms. This function allows the PCM to have full binary control at cold temperatures up to approximately 122°F, and a second full binary control at temperatures greater than 122°F.
FIGURE 13–7 An ECT sensor being tested using a digital meter set to DC volts. A chart showing the voltage decrease of the ECT sensor as the temperature increases from a cold start. The bumps at the bottom of the waveform represent temperature decreases when the thermostat opens and is controlling coolant temperature.
FIGURE 13–8 The IAT sensor on this General Motors 3800 V-6 engine is in the air passage duct between the air cleaner housing and the throttle body.