Download
1 / 8
80 likes | 225 Vues
Planner Aug 23 T: Graphs D : construct graphs placing the IV and DV in the correct area. DO NOW page 18 - Construct a data table for the following: The amount of soda affects the number of burps . The amount of soda used is 0 oz, 6 oz, 4 oz, 2 oz. Use 2 trials and a mean.

E N D
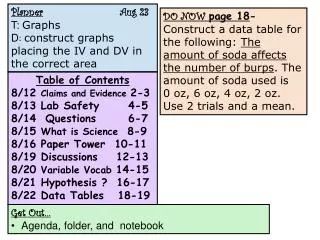
Planner Aug 23 T: Graphs D: construct graphs placing the IV and DV in the correct area DO NOW page 18- Construct a data table for the following: The amount of soda affects the number of burps. The amount of soda used is 0 oz, 6 oz, 4 oz, 2 oz. Use 2 trials and a mean. Table of Contents 8/12 Claims and Evidence 2-3 8/13 Lab Safety 4-5 8/14 Questions 6-7 8/15 What is Science 8-9 8/16 Paper Tower 10-11 8/19 Discussions 12-13 8/20 Variable Vocab 14-15 8/21 Hypothesis ? 16-17 8/22 Data Tables 18-19 • Get Out… • Agenda, folder, and notebook
What is the title of this graph? ...Adaptation Unit Test • Write the label and unit of measurement on the horizontal axis (x-axis). Class Periods (#) • Which variable is shown on the x axis? (IV, DV, or CV?) • Is the data shown numbers or words? numbers • Write the label & unit of measurement on the vertical axis (y-axis). Average Scores (%)
Which variable is shown on the y-axis? (IV, DV, or CV?) G. Is the data shown numbers or words? number I. So, what two variables must be shown in a graph? IVand DV J. Which variable goes on the x-axis? IV On the y-axis? DV
K. Name three things you observe that are different in a bar graph compared to a line graph? 1) Line graphs show change over time 2)Bar graphs compare different things. Line graphs are the same thing at different times. 3)Line graphs use dots. Bar graphs use solid figures.
Bar graphs must have: • title • IV identified on horizontal axis; DV identified on vertical axis • units of measure in parenthesis after variable label (if needed) • vertical axis numbered in equal intervals • horizontal axis labeled between the lines • space between bars
Flower Color vs. Bees Attracted Bees attracted (#) Flower Color
Birth Rate by Day of Week Birth Rate (%) Day of the Week
Exit Ticket • Explain how data tables help you set up your bar graph. Using the words Independent variable and dependent variable.