Download

1 / 21
210 likes | 335 Vues
This study investigates the hit efficiency of the current tracker under different multiplicity conditions using Hijing MinBias simulations. This involves analyzing the relationship between hit efficiency and variables such as pT and η, while applying both loose and tight cuts. Through comparative analysis, we explore how these metrics vary across different multiplicity bins with a focus on matching real data distributions. Key findings highlight areas for efficiency improvement, particularly in low pT regions, and stress the importance of optimizing hit selection to enhance overall performance.

E N D
Hit and Tracking • Data set used: Hijing MinBias simulations • Usually, absolute value of efficiency is too ideal • … comparisons between current code & IT • Approach • First look at bulk with loose cuts… • All multiplicities, fit Points > 9, |eta|<1.5, no dca cut (3 cm implicit for primaries), look only at pi+ • Then look in finer detail with realistic cuts • 3 multiplicity bins, fit Points>23, |eta|<.5, dca<1.5
Hit Efficiency vs Multiplicity Hit Efficiency = #hits in common / #MC hits • Current Tracker • Integrated Tracker
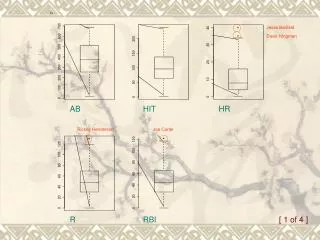
Hit Efficiency vs pT • Current Tracker • Integrated Tracker
Hit Efficiency vs Eta • Current Tracker • Integrated Tracker
Padrow of Last Hit • Current Tracker • Integrated Tracker padrow
Padrow of Last Hit vs eta • Current Tracker • Integrated Tracker
Padrow of First Hit vs Eta • Current Tracker • Integrated Tracker
Fit Points I • Current Tracker • Integrated Tracker Loose cuts: All mult, |eta|<1.5, dca<3, Fit Pts>9
Fit Points II • Current Tracker • Integrated Tracker Low, Medium, High Multiplicity Tight cuts: Fit Points>23 Dca<1.5, |eta|<0.5 Normalized To 1
Fit Point “Efficiency”: Fit Points/MC Hits • Current Tracker • Integrated Tracker Low, Medium, High Multiplicity
Mean Fit Points vs pT I • Current Tracker • Integrated Tracker
Mean Fit Points vs pT II Low, Medium, High Multiplicity • Current Tracker • Integrated Tracker
Mean Fit Points vs Eta I • Current Tracker • Integrated Tracker
Mean Fit Points vs eta II • Current Tracker • Integrated Tracker Low, Medium, High Multiplicity
“Efficiency” vs Multiplicity Here, efficiency is: All Matched Tracks All MC Tracks (even MC tracks Not in acceptance) So, absolute scale Much worse than True efficiency. • Current Tracker • Integrated Tracker
Efficiency vs pT I Here, efficiency is: Found & Matched MC Accepted i.e. as in all spectra analyses • Current Tracker • Integrated Tracker
Efficiency vs pT II • Current Tracker • Integrated Tracker Low, Medium, High Multiplicity
Efficiency vs eta I • Current Tracker • Integrated Tracker
Efficiency vs eta II • Current Tracker • Integrated Tracker Low, Medium, High Multiplicity
Snapshot of tracker and “To Do” • Shape of distributions are similar to current tracker • Mean Fit Points shows similar trends with multiplicity, pt and eta • Shape at low fit points shows a bump not seen before • Efficiency is still low comparted to current tracker • Low pT part needs tuning • Perhaps a 2nd pass removing hits already used… • Crucial to increase efficiency • Also : test distributions in embedding, need to match real data • Fit points, global DCA, etc.