Download
1 / 16
160 likes | 386 Vues
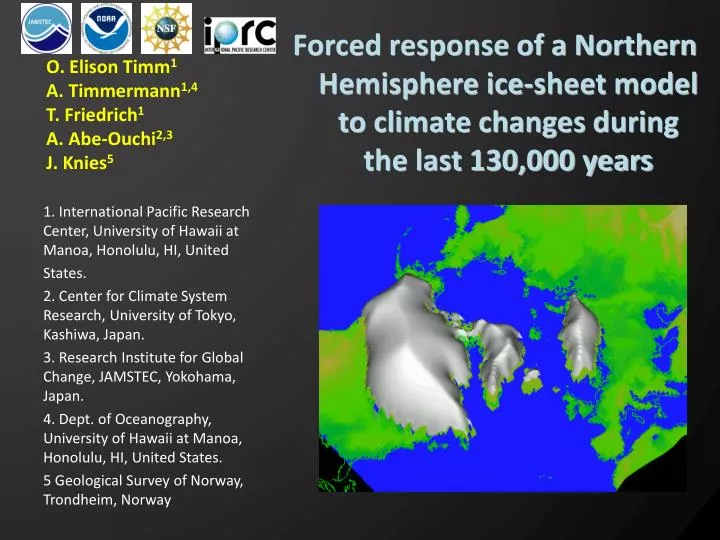
O. Elison Timm 1 A. Timmermann 1,4 T. Friedrich 1 A. Abe-Ouchi 2,3 J. Knies 5 . Forced response of a Northern Hemisphere ice-sheet model to climate changes during the last 130,000 years. 1. International Pacific Research Center, University of Hawaii at Manoa, Honolulu, HI, United States.

E N D
O. Elison Timm1A. Timmermann1,4T. Friedrich1A. Abe-Ouchi2,3J. Knies5 Forced response of a Northern Hemisphere ice-sheet model to climate changes during the last 130,000 years 1. International Pacific Research Center, University of Hawaii at Manoa, Honolulu, HI, United States. 2. Center for Climate System Research, University of Tokyo, Kashiwa, Japan. 3. Research Institute for Global Change, JAMSTEC, Yokohama, Japan. 4. Dept. of Oceanography, University of Hawaii at Manoa, Honolulu, HI, United States. 5 Geological Survey of Norway, Trondheim, Norway
Introduction • Glacial-Interglacial Cycles • What are the driving forces? Orbital forcing: precession and/or obliquity. (Berger in the 1970s, P. Huybers, 2005, 2006, 2010) Prolonged synchronous increase in NH and SH summer insolation (Schulz and Zeebe (2006)) • How important are internal feedbacks? Changes in land albedo, sea-ice, ocean circulation, vegetation, carbon cycle. • Methods: • Transient paleoclimatesimulations • Time-slice sensitivity experiments We use LOVECLIM (V1.0) an ’Earth System Model of Intermediate Complexity’ to obtain atmospheric forcing fields for the community Ice-sheet model GLIMMER
Hypothesis:Increasing summer insolation triggers ice-sheet discharge,reduction in Atlantic Meridional OverturningCirculation, NH cooling, and thus negative, stabilizing feedback. • IRD events during times of increasing summer insolation time (Timmermann et al., Paleoceanography, 2010) H6 C24 C21
LOVECLIM Transient external forcing albedo + orography Ice-sheet forcing from IcIES ECBilt – atmosphere T21, L3 VECODE – vegetation t2m,precip albedo t2m precip aia aia air-sea fluxes CO2 fluxes CLIO – ocean sea-ice 3x3, L20 LOCH – Marine carbon cycle Freshwater Forcing
External forcing Sources: Daily mean irradiance for true longitude λ=90o (mid-June) were calculated with the routines provided by Dr. Laskar (Laskar 2004). Atmospheric CO2 derived from Antarctic ice-cores (as described in Timm et al, Paleoceanography, 2008) time
Modeling Approach: Proxy records with time series of atmospheric CO2 and orbital forcing (130,000 BP – 0 BP) (Abe-Ouchi et al, Clim. Past., 2007) Northern Hemisphere Ice-sheet model (IcIES) with time dependent atm. forcing NH ice thickness, orography. (130,000 BP – 0 BP) Obtain atmospheric response patterns to CO2 and orbital forcing with GCM model For our transient simulations and sensitivity studies, we use LOVECLIM (V1.0) an Earth System Model Of Intermediate Complexity Northern Hemisphere Ice-Sheet model (GLIMMER*) with time dependent atm. forcing. LOVECLIM: Transient simulation with forcing from NH ice-sheets, orbital changes, and atm. CO2 * Rutt, I. C., M. Hagdorn, N. R. J. Hulton, and A. J. Payne, J. Geophys. Res., 114, F02004, 2009
Why does precessional forcing not lead to glacial terminations before 19 ka BP? • Shutdown of the Atlantic Meridional Overturning Circulation (AMOC) Difference in summer air temperatures 102ka BP minus 114ka BP. (high minuxs low NH summer insolation) Difference in summer air temperatures at 108ka BP with/ without freshwater input into North Atlantic (AMOC shutdown – active AMOC)
Shutdown of the Atlantic Meridional Overturning Circulation (AMOC) Why does precessional forcing not lead to glacial terminations before 19 ka BP? LOVECLIM simulation: Diagnosed mass balance over the ice-sheets of North America and Greenland LOVECLIM simulation: Diagnosed mass balance over the ice-sheets of Eurasia time time
Last glacial termination and Heinrich 1 event • Shutdown of the Atlantic Meridional Overturning Circulation (AMOC) Difference in annual mean air temperatures between 18 and 17ka BP Difference in annual mean air temperatures at 18-17 ka BP with 17ka BP shutdown of AMOC.
GLIMMER* forced withclimatological annual cyclefrom transient simulation with LOVECLIM and freshwater forcing in North Atlantic.Climatology at 18 and 17ka BP(with bias correction) • Effect of AMOC shutdown onto NH ice-sheets 18 ka BP (active AMOC) equilibrium 17 ka BP (AMOC shutdown) equilibrium * Rutt, I. C., M. Hagdorn, N. R. J. Hulton, and A. J. Payne, J. Geophys. Res., 114, F02004, 2009
Effect of incremental CO2 increase and insolation increase onto NH ice-sheets GLIMMER* forced withclimatological annual cyclefrom transient simulation with LOVECLIM without freshwater input. Climatology at 18 and 17ka BP(with bias correction) 18 ka BP (active AMOC) equilibrium 17 ka BP (AMOC active) equilibrium * Rutt, I. C., M. Hagdorn, N. R. J. Hulton, and A. J. Payne, J. Geophys. Res., 114, F02004, 2009 images created with IDV (Integrated Data Viewer)
GLIMMER forced withclimatological annual cyclefrom transient simulation LOVECLIM at 18 an 17ka BP • Effect of AMOC shutdown onto NH ice-sheets Adjustment to THC shutdown 7.5 17 ka AMOC shutdown -1000m 6.9 NH ice volume [10^15 m^3] +2000m 17 ka BP active AMOC time 6.3 2 4 6 8 10 12 14 Difference after 15000 model years Adjustment over 15000 model years
Transient Ice-Sheet Modeling Approach: Proxy records with time series of atmospheric CO2 and orbital forcing (130,000 BP – 0 BP) (Abe-Ouchi et al, Clim. Past., 2007) Northern Hemisphere Ice-sheet model (IcIES) with time dependent atm. forcing NH ice thickness, orography. (130,000 BP – 0 BP) Obtain atmospheric response patterns to CO2 and orbital forcing with GCM model For our transient simulations and sensitivity studies, we use LOVECLIM (V1.0) an Earth System Model Of Intermediate and the community ice-sheet model GLIMMER* Northern Hemisphere Ice-Sheet model (GLIMMER*) with time dependent atm. forcing. LOVECLIM: Transient simulation with forcing from NH ice-sheets, orbital changes, and atm. CO2 * Rutt, I. C., M. Hagdorn, N. R. J. Hulton, and A. J. Payne, J. Geophys. Res., 114, F02004, 2009
Comparison between theice-sheet simulationsobtained with IcIES,LOVECLIM-GLIMMERand ICE5G (Peltier, 2004) • IcIES, GLIMMER simulation Termination I simulated with IcIES and GLIMMER lags the ICE5G reconstructed timing of the deglaciation. LOVECLIM-GLIMMER underestimates the early buildup of the Eurasian ice-sheet. time
Effect of global temperature offset on ice-volume • GLIMMER simulation t2m offset 8 2 1 0 -1 -2 -8 LOVECLIM-GLIMMER: problem with the early buildup of the Eurasian ice-sheet: Sensitivity runs with temperature offsets (-8, -2, -1, 1, 2, 8 K ) suggest negative precipitation bias is the likely cause for the failure in ice-sheet buildup over Eurasia between MIS5a-d (115-80ka B.P.) With cooler global temperatures (larger ice-volumes) the response to precessional forcing increases. time
Summary Forced response of a global ice-sheet model to climate changes during the last 130,000 years • What are the driving forces? Ice-sheet simulations indicate strong sensitivity to precessionally driven summer insolation changes. • How important are internal feedbacks? We discussed an additional feedback: AMOC shutdown provide stabilizing, negative feedback mechanism for ice-sheet growth. => The sequence of freshwater input into the North Atlantic between 115ka and 80ka BP could have helped to sustain glacial conditions during periods of high summer insolation.


![Jacobi’s formula: A -1 = Adj (A) where Adj (A) i,j = (-1) i+j det (A[ j,i ])](https://cdn1.slideserve.com/1992952/slide1-dt.jpg)


![>> W1=[1 1 1 1;1 -j -1 j;1 -1 1 -1;1 j -1 -j] W1 =](https://cdn1.slideserve.com/3227081/slide1-dt.jpg)

![C[ i ][j]=A[ i ][1]+B[1][j]](https://cdn2.slideserve.com/3988576/slide1-dt.jpg)

![Statistics [1/2,3/2]](https://cdn2.slideserve.com/4297614/statistics-1-2-3-2-dt.jpg)
![[1]. D. O. Hogenboom, C. A. DiMarzio, T. J. Gaudette, A. J. Devaney, and S. C.](https://cdn2.slideserve.com/4449989/slide1-dt.jpg)