Download
1 / 1
40 likes | 192 Vues
This document provides a detailed overview of Taylor diagrams, showcasing how to effectively implement and customize them using the "deftaylor" template. It discusses features such as correlation values and standard deviation adjustments, as well as the layout and orientation of the diagram elements. The guidelines detailed here are ideal for creating accurate visual representations of model performance and uncertainty assessments in various scientific fields. Follow the recommendations for utilizing the provided template to enhance the clarity and aesthetics of your diagrams.

E N D
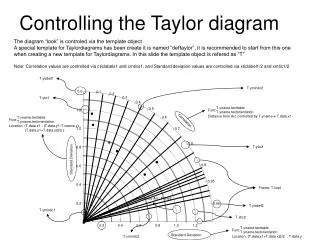
T.yname.texttable T.yname.textorientation T.yname.texttable T.yname.textorientation T.yname.texttable T.yname.textorientation Font: Font: Font: Distance from Arc controlled by T.yname-x-T.data.x1 Location: (T.data.x1+T.data.x2)/2. , T.data.y Location: (T.data.x1 - (T.data.y1-T.xname.y), (T.data.y1+T.data.y2)/2 ) The diagram “look” is controled via the template object A special template for Taylordiagrams has been create it is named “deftaylor”, it is recommended to start from this one when creating a new template for Taylordiagrams. In this slide the template object is refered as “T” Note: Correlation values are controlled via cticlabels1 and cmtics1, and Standard deviation values are controlled via xticlabel1/2 and xmtic1/2 Controlling the Taylor diagram T.ylabel1 T.ymintic2 0.0 0.1 0.2 T.ytic1 0.3 0.4 0.5 1.2 0.6 Correlation 1.0 0.7 0.8 T.ytic2 0.8 Standard Deviation 0.9 0.6 0.95 0.4 Frame: T.line1 Reference Arc: T.line2 0.2 0.99 T.ylabel2 T.ymintic1 T.xtic2 0.2 0.4 0.6 0.8 1.0 1.2 T.xmintic2 Standard Deviation