
Table 1 :
LANDSAT ETM+ IMAGE: Date July 1999. Fig. 1. Fig. 2. Fig. 4. Fig. 3. COMPARATIVE ANALYSIS OF DIFFERENT RESERVOIR SURVEYING METHODOLOGIES FOR THE OPTIMUM VOLUMETRIC COMPUTATION OF FLUVIAL SEDIMENT DEPOSITS Demetris Zarris 1 , Evdoxia Lykoudi 2
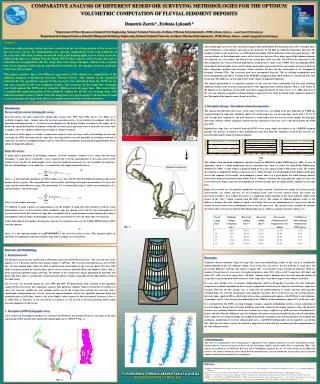

Table 1 :
E N D
Presentation Transcript
LANDSAT ETM+ IMAGE: Date July 1999 Fig. 1 Fig. 2 Fig. 4 Fig. 3 COMPARATIVE ANALYSIS OF DIFFERENT RESERVOIR SURVEYING METHODOLOGIES FOR THE OPTIMUM VOLUMETRIC COMPUTATION OF FLUVIAL SEDIMENT DEPOSITS Demetris Zarris 1, Evdoxia Lykoudi 2 1 Department of Water Resources, School of Civil Engineering, National Technical University of Athens, 5 Heroon Polytechneiou St., 15780, Athens, Greece,e-mail: zarris@itia.ntua.gr 2Department of Geological Sciences, School of Mining and Metallurgy Engineering,National Technical University of Athens, 9 Heroon Polytechneiou St.,15780,Athens, Greece, e-mail: mmgpel@central.ntua.gr Abstract Reservoir sedimentation studies provide a useful tool for the determination of the actual) of the reservoir’s invert. In sedimentation rate and the computation of the real useful life of the reservoir. This task is often carried out with a full hydrographic survey of the reservoir, which feeds data to a Digital Terrain Model (DTM other regions of the world, this task is alternatively accomplished with the range lines surveying technique, which is less accurate but is less expensive and copious and therefore suitable for developing countries and large scale reservoir systems. This paper examines these two different approaches of the volumetric computation of the sediment deposits at Kremasta reservoir, Western Greece. The volume of the deposited sediment for the Agrafiotis segment of the reservoir was calculated from the DTM survey and was accepted as the true sediment volume. The accuracy of the range line technique was tested against the DTM survey using five different sets of range lines. The results show a considerable underestimation of the sediment volume for all the sets of range lines. The underestimation is more evident when the range lines are sparse and it is shown that beyond a certain number of range lines there is no improvement of the overall estimation. The hydrographic survey has been carried out using a differential Global Positioning System (GPS) technique and a typical fathometer (echo-sounder) operating at the frequency of 130 kHz for depth determination. Therefore the method is subject to the usual errors e.g. GPS limited availability and the definition of the water-mud interface. The average distance of the hydrographic routes of the vessel was between 50 m, where most of the sediment deposits was expected, (e.g. river deltas) and 200 m in the central part of the reservoir. The DTM at the time prior to the dam completion was constructed from digitising the original survey maps (scale 1:5000). The corresponding DTMs from both the hydrographic survey and the initial topographic maps resulted from an irregular network of points in three dimensions (position and elevation), which constitute the base for the construction of the Triangulated Irregular Network (TIN). The associated grids were interpolated from the TINs by utilizing triangulation with linear interpolation procedures available in the SURFER mapping package. Both models are constructed with a 6m by 6m grid. The difference in elevation results in the volume of deposited sediments. The spatial distribution of accumulated sediment in the reservoir shows profoundly that the total incoming sediment remains in the reservoir and particularly at the uppermost parts (deltaic deposits) (Fig. 2). The volume of the deposits at the Agrafiotis section of the reservoir is computed equal to 13.1 hm3 (Zarris et al., 2002). The area of the reservoir segment occupied by sediment deposits is equal to 2.5 km2 while the length of the segment is almost 5.5 km. The depth of the deposits ranges from 5 m to 10 m. 3. Description of range – line sediment volumetric computation The analysis described hereafter refers to the same reservoir area. According to the first indication by USBR the required number of range lines should be equal to 19. In this paper, five sets of range lines consist with 7, 16, 19, 27 and 33 range lines respectively. The main objective is to determine how the increase of the number of range lines affects the sediment volume estimation and how far this estimation is from the “real” value derived from the DTM procedure. Hypothetical range lines are derived from the DTM survey using simple procedures in the SURFER mapping package. For instance, in Figure 6, three hypothetical range lines from the Agrafiotis section of the reservoir are presented showing the depth of sediment deposits. The volume of the deposited sediment is calculated using the RESSASS model (HRWallingford, 2001). It uses an algorithm, which is a slight modification of the trapezoidal rule, and it is called the Stage-Width Modification Method (Lea, 1991). A stage-width is a graph of depth on the y-axis against section width on the x-axis. The volume of a segment is computed by fitting a stage-area curve, which describes the relationship between depth and the plan area of the segment at that depth. An assumption is made, that is at a given depth, the width changes linearly between the upstream and downstream widths (Fig. 4). Volume is calculated by integrating the stage-area curve for a reservoir reach. Figure 5 presents the hypothetical network of range lines for almost all the available sets of range lines. Range lines selected are not generally equidistant, but their selection is based on the change of certain reservoir characteristics (e.g. width) and they are also restricted in the same reservoir segment extent. The results are presented in Table 1. It is evident that there is a significant underestimation of the total sediment volume with respect to the “true” volume resulted from the DTM survey. The volume of sediment deposits results as the difference between the total volume of stored water before the reservoir impoundment at a given level and the volume of stored water at the hydrographic survey for the same level. This specific level is actually the absolute elevation of the reservoir stage during the hydrographic survey, which is assumed constant (+269 m a.s.l.). Introduction The necessity for reservoir hydrographic surveys Reservoir surveys are often required for, among other reasons (Lea, 1991; Sloff, 1991; Zarris et al., 2002), (a) to establish or update stage – volume curves for reservoir operation surveys, (b) to calculate the sediment yield of the upstream hydrological basin, (c) to assist reservoir designers to the design of other reservoirs in the region, (d) to predict the spatial distribution of sediment within the reservoir and in particular close to hydraulic structures such as intakes, and (e) to evaluate methods of prevention or sediment removal. The objective of this paper is to make a comparative analysis of the two most widely used methods of reservoir surveying, the DTM surveying and the range lines surveying and to assess the possibility of installing a network of range lines in order to accomplish frequent surveys with the least expenditure and maximum approximation of the volume of deposited sediments. Range line surveys In many places, particular in developing countries, reservoir managers continue to use range line surveying techniques. A range line is essentially a cross section of the reservoir, perpendicular to the main course of the original river. Consider the hydrographic survey based on depth measurements in a given number of range lines. The area of deposition, S, in a range line, y, is estimated by the simple trapezoidal rule as: (1) where, xi is the horizontal coordinate of a survey point, i =1,..,n+1; H is the observed depth of sediments and n is the number of survey points. The trapezoidal rule can be used for calculating, using point measurements, the areas in a range and the volume between ranges. The total volume, Vol, is estimated by using (1) with cross-sectional areas S(y) and the distances y between ranges (2) where N is the number of ranges. It is difficult to make a precise recommendation as to the number of range lines that should be used for a post impoundment survey as the sensitivity of the method to range line spacing varies with the type and complexity of the reservoir involved. The number of range lines is assumed to be a crucial parameter in determining the accuracy that might be achieved from a hydrographic survey and is related more to reservoir shape than reservoir size. A first indication of the number of range lines that may be required is given by the USBR (HRWallingford, 2001) from the equation (3) where, N is the required number of range lines and A is the reservoir surface in km2. This equation makes no allowance for additional range lines needed to cope with a complex reservoir pattern. Fig. 6 Table 1: Materials and Methodology 1. Kremasta reservoir The Kremasta reservoir was constructed in 1964 and is located in North-Western Greece. The reservoir area at the spillway crest is 80.6 km2 and the total storage volume is 4495 hm3. The reservoir watershed has an area of 3292 km2, elevation ranging from +284 m to +2433 m and the mean annual inflow to the reservoir equals 117.1 m3/s. This inflow is largely provided by Acheloos River and to a lesser extent by Agrafiotis River and Megdovas River (Fig. 1). Mean annual precipitation equals 1433 mm. The geology of the catchment is largely dominated by limestone and flysch. The latter shows a considerable erosion potential which is mainly responsible for the high sediment yield of the whole basin. The reservoir was surveyed during the years 1998 and 1999. We particularly draw attention to the Agrafiotis segment of the reservoir for our comparative analysis. This particular segment, which is actually the river delta as it enters the reservoir, exhibits the least complex pattern of all the streams that entering the reservoir, with a considerable sedimentation rate. In fact, the mean annual sediment yield of the Agrafiotis upstream basin was estimated equal to 2035 t/km2, which is one of the highest values reported in the international literature (Zarris et al., 2002) (Fig. 2). Therefore, it was selected for our analysis so as to succeed in the least distortion of the results from the complexity of the terrain. 2. Description of DTM hydrographic survey A key element of the proposed method is to construct the DTMs for two periods of interest, one prior to the dam construction (1964) and the other during the hydrographic survey (1998-99) (Fig. 3). Discussion Sediment volume estimation using the range lines surveying methodology results in our case in a considerable underestimation of the real sediment volume. Even at the best case, that is the one with the 27 range lines, the percentage difference with the real volume is almost 18%, or in absolute terms, 2.4 hm3 of sediments. With less number of range lines it’s even worse, the underestimation is above 30% with a set of 7 range lines (4.21 hm3) and above 25% with a set of 16 range lines (3.38 hm3). Volume analysis becomes more accurate when the number of range lines is increasing until further increase of the range lines seems not to improve the volume calculation. It is not clear whether it is a systematic underestimation valid for all possible reservoirs since the volumetric computation is mainly dependent on the reservoir configuration and also on the subjective and arbitrary range lines selection. However, for this specific case, it seems that the underestimation is serious and may affect possible remedial plans for reservoir maintenance and sediment extraction. Even at the best case, the average distance between ranges equals to 200 m, which tends to be as time-consuming and copious as the DTM surveying technique. Accordingly, for the value of range lines indicated by the USBR the underestimation is almost 25% of the real value. It is concluded that the DTM surveying technique remains a superior methodology for the accurate calculation of reservoir deposits. Range lines technique should be used with caution for developing countries where the financial resources are extremely limited or when very frequent surveying is required (e.g. small reservoirs for hydroelectric plants) and also when the additional costs for sediment extraction is counterbalanced from the reduced expenditure of the range line surveying technique. It is proposed that before installing a network of range lines for frequent and continuous monitoring of reservoir sedimentation rates, a full DTM hydrographic survey should be carried out first. This has to be done in order to establish a range line network with the maximum possible approximation of the real sediment volume. Acknowledgments This work is a continuation of the research project “Appraisal of river sediment deposits in reservoirs of hydropower dams” funded from the General Secretariat of Research and Technology (GSRT) and the Public Power Corporation (PPC). The authors are indebted in the Hydraulic Research Ltd at Wallingford, England, for the very kind offering of the RESSASS software. The authors would like also to thank Demetris Koutsoyiannis, research coordinator of the project, for his valuable comments and assistance during the research project. References HYDRAULIC RESEARCH LTD. 2001. Measuring and predicting reservoir volume changed due to sedimentation: RESSASS Version 1.5, User Manual, Wallingford, England. LEA, N.J. 1991. Analysis of reservoir range lines surveys using the stage width modification method, Report OD/TN 56, April, HR Wallingford, 18p. SLOFF, C.G. 1991. Reservoir sedimentation: A literature survey, Communications on hydraulic and geotechnical engineering, Delft University of Technology, 126p. ZARRIS, D., LYKOUDI, E. and KOUTSOYIANNIS, D. 2002. Sediment yield estimation from a hydrographic survey: A case study for the Kremasta reservoir basin, Greece, Proceedings of the 5th International Conference “Water Resources Management in the Era of Transition”, Athens, 4-8 September, 338-345 p. Fig. 5 7ο ΠΑΝΕΛΛΗΝΙΟ ΣΥΜΠΟΣΙΟ ΩΚΕΑΝΟΓΡΑΦΙΑΣ & ΑΛΙΕΙΑΣ ΧΕΡΣΟΝΗΣΟΣ ΚΡΗΤΗΣ 6-9 ΜΑΪΟΥ 2003