Download
1 / 6
60 likes | 191 Vues
A spreadsheet is an Excel worksheet that functions like a large calculator, making it simple to perform calculations, percentages, and data organization. It presents information in a grid format of rows and columns and leverages formulas to process data efficiently. Learn to create various charts, such as bar graphs, line charts, and pie charts. Formulas are vital for performing calculations, and they start with an equals sign (=). This guide simplifies working with symbols, rows, columns, and creating engaging visual data representations through charts.

E N D
All about spread sheets By Ashvi Daia
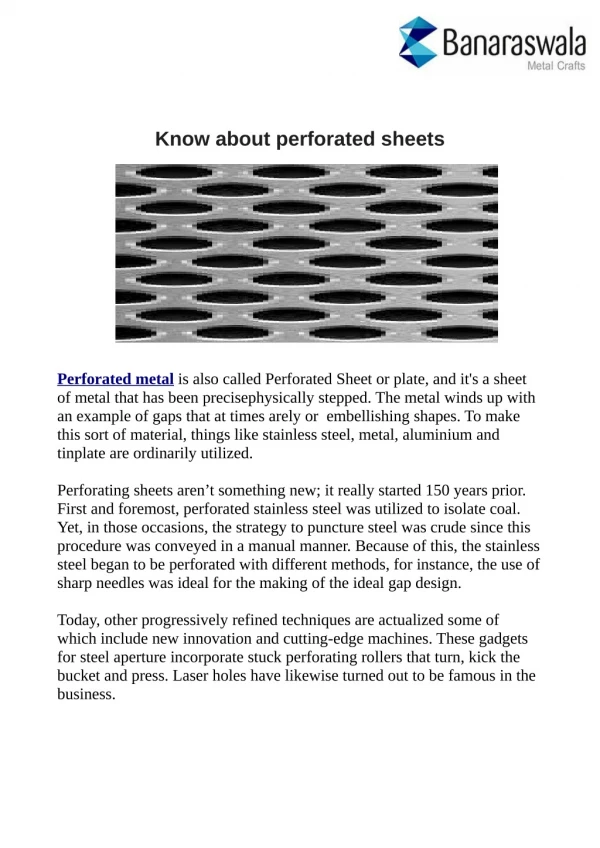
What is a spread sheet? • A spread sheet is a worksheet on Excel. It’s like a big calculator that makes it easy to work out calculations, it’s comes in handy in working out sums or working out percentages and many, many other things. It sorts data in a huge grid with many rows and columns. Spread sheets work things out when you use formulas. You can make charts, like bar charts, line graphs, pie charts and many other things…
Formulas • You write Formulas to work out, it’s like the instructions you give to work out something. You use symbols to do this. • Here’s what I learnt: You always use a equals sign(=)when you start a formula. If you want to write a formula to add two numbers from two cells you use the plus sign and for subtract a minus sign. On the other hand if you want to times you use a star, and for divide, a slash.