Biological Network Analysis
Biological Network Analysis. The genomic era. Human genome sequence “completed”, Feb 2001. PubMed abstracts indicate a recent interest in Systems Biology. Human genome completed. Protein-protein interaction data. Physical Interactions Yeast two hybrid screens
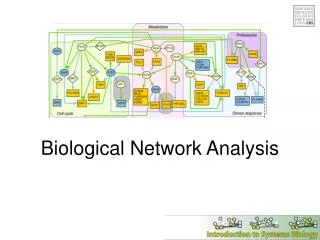

Biological Network Analysis
E N D
Presentation Transcript
The genomic era Human genome sequence “completed”, Feb 2001
PubMed abstracts indicate a recent interest in Systems Biology Human genome completed
Protein-protein interaction data • Physical Interactions • Yeast two hybrid screens • Affinity purification (mass spec) • Peptide arrays • Protein-DNA by chIP-chip • Other measures of ‘association’ • Genetic interactions (double deletion mutants) • Genomic context (STRING)
Yeast two-hybrid method Y2H assays interactions in vivo. Uses property that transcription factors generally have separable transcriptional activation (AD) and DNA binding (DBD) domains. A functional transcription factor can be created if a separately expressed AD can be made to interact with a DBD. A protein ‘bait’ B is fused to a DBD and screened against a library of protein “preys”, each fused to a AD.
Can a biologist fix a radio? Lazebnik, Cancer Cell, 2002
Protein-DNA interactions Gene levels (up/down) Protein-protein interactions ▲Protein coIP ▼ Mass spectrometry Protein levels (present/absent) Biochemical reactions Biochemical levels ▲ Chromatin IP ▼ DNA microarray ▲none Metabolic flux ▼ measurements
One framework for Systems Biology • The components.Discoverall of the genes in the genome and the subset of genes, proteins, and other small molecules constituting the pathway of interest. If possible, define an initial model of the molecular interactions governing pathway function (how?). • Pathway perturbation. Perturb each pathway component through a series of genetic or environmental manipulations. Detect and quantify the corresponding global cellular response to each perturbation.
One framework for Systems Biology • Model Reconciliation.Integrate the observed mRNA and protein responses with the current, pathway-specific model and with the global network of protein-protein, protein-DNA, and other known physical interactions. • Model verification/expansion. Formulate new hypotheses to explain observations not predicted by the model. Design additional perturbation experiments to test these and iteratively repeat steps (2), (3), and (4).
Continuum of modeling approaches Top-down Bottom-up
Data integration and statistical mining Need computational tools able to distill pathways of interest from large molecular interaction databases (top-down)
Types of information to integrate • Data that determine the network (nodes and edges) • protein-protein • protein-DNA, etc… • Data that determine the state of the system • mRNA expression data • Protein modifications • Protein levels • Growth phenotype • Dynamics over time
Mapping the phenotypic data to the network • Systematic phenotyping of 1615 gene knockout strains in yeast • Evaluation of growth of each strain in the presence of MMS (and other DNA damaging agents) • Screening against a network of 12,232 protein interactions Begley TJ, Rosenbach AS, Ideker T, Samson LD. Damage recovery pathways in Saccharomyces cerevisiae revealed by genomic phenotyping and interactome mapping. Mol Cancer Res. 2002 Dec;1(2):103-12.
Mapping the phenotypic data to the network Begley TJ, Rosenbach AS, Ideker T, Samson LD. Damage recovery pathways in Saccharomyces cerevisiae revealed by genomic phenotyping and interactome mapping. Mol Cancer Res. 2002 Dec;1(2):103-12.
Mapping the phenotypic data to the network Begley TJ, Rosenbach AS, Ideker T, Samson LD. Damage recovery pathways in Saccharomyces cerevisiae revealed by genomic phenotyping and interactome mapping. Mol Cancer Res. 2002 Dec;1(2):103-12.
Network models can be predictive Green nodes represent proteins identified as being required for MMS resistance; gray nodes were not tested as part of the 1615 strains used in this study; blue lines represent protein-protein interactions. The untested gene deletion strains (ylr423c, hda1, and hpr5) were subsequently tested for MMS sensitivity; all were found to be sensitive (bottom). Begley TJ, Rosenbach AS, Ideker T, Samson LD. Damage recovery pathways in Saccharomyces cerevisiae revealed by genomic phenotyping and interactome mapping. Mol Cancer Res. 2002 Dec;1(2):103-12.
Network Example - The Internet http://www.jeffkennedyassociates.com:16080/connections/concept/image.html
Network Representation regulates regulatory interactions (protein-DNA) gene B gene A binds functional complex B is a substrate of A (protein-protein) gene B gene A reaction product is a substrate for metabolic pathways gene B gene A
Network Measures • Degree ki • Degree distribution P(k) • Mean path length • Network Diameter • Clustering Coefficient
Network Analysis Paths: metabolic, signaling pathways Cliques: protein complexes Hubs: regulatory modules Subgraphs: maximally weighted
Graphs • Graph G=(V,E) is a set of vertices V and edges E • A subgraph G’ of G is induced by some V’V and E’ E • Graph properties: • Connectivity (node degree, paths) • Cyclic vs. acyclic • Directed vs. undirected
Sparse vs Dense • G(V, E) where |V|=n, |E|=m the number of vertices and edges • Graph is sparse if m~n • Graph is dense if m~n2 • Complete graph when m=n2
Connected Components • G(V,E) • |V| = 69 • |E| = 71
Connected Components • G(V,E) • |V| = 69 • |E| = 71 • 6 connected components
Paths A path is a sequence {x1, x2,…, xn} such that (x1,x2), (x2,x3), …, (xn-1,xn) are edges of the graph. A closed path xn=x1 on a graph is called a graph cycle or circuit.
Small-world Network • Every node can be reached from every other by a small number of hops or steps • High clustering coefficient and low mean-shortest path length • Random graphs don’t necessarily have high clustering coefficients • Social networks, the Internet, and biological networks all exhibit small-world network characteristics
Degree Distribution P(k) is probability of each degree k, i.e fraction of nodes having that degree. For random networks, P(k) is normally distributed. For real networks the distribution is often a power-law: P(k) ~ k-g Such networks are said to be scale-free
Target the hubs to have an efficient safe sex education campaign Lewin Bo, et al., Sex i Sverige; Om sexuallivet i Sverige 1996, Folkhälsoinstitutet, 1998
Scale-Free Networks are Robust • Complex systems (cell, internet, social networks), are resilient to component failure • Network topology plays an important role in this robustness • Even if ~80% of nodes fail, the remaining ~20% still maintain network connectivity • Attack vulnerability if hubs are selectively targeted • In yeast, only ~20% of proteins are lethal when deleted, and are 5 times more likely to have degree k>15 than k<5.
Other Interesting Features • Cellular networks are assortative, hubs tend not to interact directly with other hubs. • Hubs tend to be “older” proteins (so far claimed for protein-protein interaction networks only) • Hubs also seem to have more evolutionary pressure—their protein sequences are more conserved than average between species (shown in yeast vs. worm) • Experimentally determined protein complexes tend to contain solely essential or non-essential proteins—further evidence for modularity.
Identifying protein complexes from protein-protein interaction data require computational tools. Identifying protein complexes from PPI data Barabasi & Oltvai, Nature Reviews, 2004
Clustering Coefficient The density of the network surrounding node I, characterized as the number of triangles through I. Related to network modularity k: neighbors of I nI: edges between node I’s neighbors The center node has 8 (grey) neighbors There are 4 edges between the neighbors C = 2*4 /(8*(8-1)) = 8/56 = 1/7
Summary: Network Measures • Degree ki The number of edges involving node i • Degree distribution P(k) The probability (frequency) of nodes of degree k • Mean path length The avg. shortest path between all node pairs • Network Diameter • i.e. the longest shortest path • Clustering Coefficient • A high CC is found for modules