Download
1 / 9
90 likes | 244 Vues
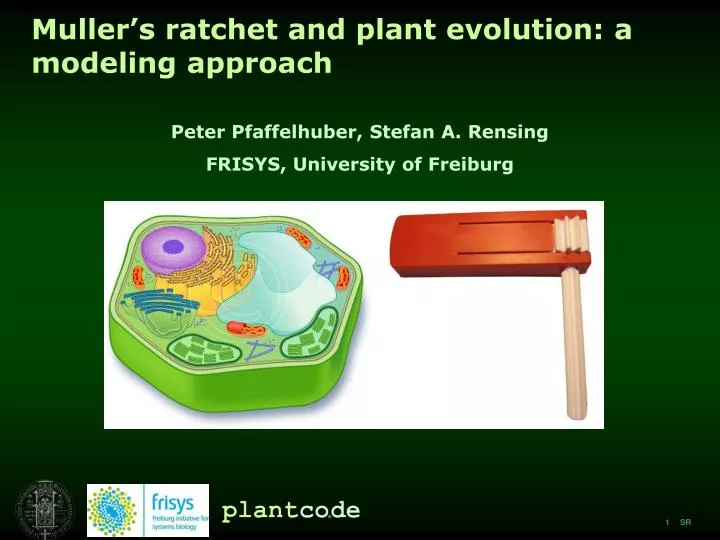
Muller’s ratchet and plant evolution: a modeling approach. Peter Pfaffelhuber, Stefan A. Rensing FRISYS, University of Freiburg. Editing in plants. Post-transcriptional change of RNA in semi-autonomous organelles (plastids and mitochondria)

E N D
Muller’s ratchet and plant evolution: amodeling approach Peter Pfaffelhuber, Stefan A. Rensing FRISYS, University of Freiburg
Editing in plants Post-transcriptional change of RNA in semi-autonomous organelles (plastids and mitochondria) Main function: remedy errors in the DNA code that have occurred through point mutations Regulatory roles Compensatory mutations in the nuclear genome: e.g. PPRs (Pentatricopeptide repeat proteins) e.g., Maier et al. (2008) BMC Biology 6:36
The mathematical model Assumptions - infinite population size (Muller‘s ratchet in a finite population has not been solved; this simplification has been used before) - (mildly) deleterious organellar mutations accumulate over time (rate λ) - compensatory nuclear mutations occur with a significantly higher rate (γ)(and remedy the organellar mutations and their associated selective disadvantage) - selection coefficient (s) with multiplicative fitness, i.e. an individual with k deleterious mutations has an offspring distribution with expectation proportional to (1 - s)k
The model II. probability measures on natural numbers distribution vector distribution at a given t
The model III. k lambda gamma time [Ma] compensation k -> k-1 time derivative selection gain k -> k+1 • population in equilibrium • 0 < s << λ << γ << 1 • - individual: birth-death process • (k<=1 at any t)
Rates per lineage 1.5E-8 monocots 6.5E-9 dicots Gaut et al. (1996) PNAS 93:10274 Koch et al. (2000) Mol Biol Evol 17:1483 Rensing et al. (2007) BMC Evol Biol 7:130 1.12E-10 chloroplastic [substitutions per site and year] 9.4E-09 nuclear Chiang & Schaal (2000) Genome 43:417 atpB-rbcL spacer of chloroplast DNA in 11 mosses
Rates per time period Estimate missing nodes using r8s -> finer granularity Calculate rates per lineage and time interval -> avg. rates per time period 100-0 2.22E-10 200-100 1.99E-10 300-200 1.37E-10 380-300 2.02E-10 p < 9E5 450-380 8.12E-10
Questions (to be) answered - Can the compensatory mutation hypothesis help to explain why organellar genomes have not deteriorated? YES - Editing sites are gained with the approximate rate of mutation fixation -> no apparent selective disadvantage - Are there different rates of gain [and loss] of editing sites (λ) and/or compensatory nuclear mutations (γ) among different lineages that can be derived from the data? YES, for λ (loss and γ pending) - Are there time periods with differing rates? YES, after the water-to-land transition
Acknowledgements Freiburg Andrej Depperschmidt Peter Pfaffelhuber Stefan Rensing Berlin Michael Tillich