Download

1 / 22
220 likes | 242 Vues
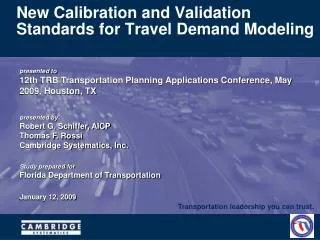
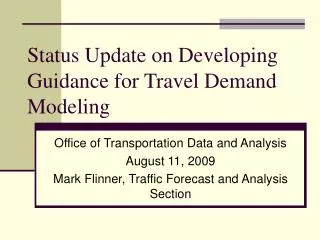
New Calibration and Validation Standards for Travel Demand Modeling. Transportation leadership you can trust. presented to 12th TRB Transportation Planning Applications Conference, May 2009, Houston, TX presented by Robert G. Schiffer, AICP Thomas F. Rossi Cambridge Systematics, Inc.

E N D
New Calibration and Validation Standards for Travel Demand Modeling Transportation leadership you can trust. presented to12th TRB Transportation Planning Applications Conference, May 2009, Houston, TX presented byRobert G. Schiffer, AICP Thomas F. RossiCambridge Systematics, Inc. Study prepared for Florida Department of Transportation January 12, 2009
Presentation Overview • Background • Literature Review • Recommended Calibration andValidation Guidelines and Standards • LRTP Models with Transit • Other Model Applications • Calibration and ValidationBest Practices • Guidelines for Model Application • Next Steps
Background • Follow-up to Phase I Study on model parameters • Phase I Final report is available for downloading at • http://www.fsutmsonline.net/images/uploads/mtf-files/FSUTMS-Cube_Parameters.pdf • Phase II Study on calibration standards included four subtasks • Literature Review • Model Calibration/Validation Guidelines and Standards • Best Practices for Model Calibration/Validation • Documentation – 1) Calibration and Validation Standards;2) Best Practices for Model Validation; 3) Guidelines forModel Application
Background (continued) • Calibration versus validation • Calibration – process where models are adjusted to simulateor match observed travel behavior in the study area • Validation – procedure used to adjust models to simulatebase-year traffic counts and transit ridership figures • Standards versus guidelines/benchmarks • Standards – desirable accuracy levels for comparing estimated versus observed metrics • Benchmarks – documented statistical ranges from literature review, model outputs, NHTS, etc. • Purposes of validation process • Level of comfort to planners, agency staff, and elected officials • Evidence that model is accurate enough for specific application • Accounts for errors in observed comparative data
Literature Review Checklist of Available Validation Standards from Literature – Trip Generation • 60+ documents reviewed • Specific models • Technical reports • Model outputs • Reference reports • Federal agencies/TMIP • State DOT guidelines and standards • Prepared ranges of acceptability
Recommended Guidelines and StandardsChecking Input Data • Socioeconomic data • Visual comparisons • Statistical comparisons • Regionwide comparisons(below) • Persons perDU (or HH) • Employment/population ratio • Autos/DU (or HH)
Recommended Guidelines and StandardsChecking Input Data (continued) • Highway network data • Transit network data • Highway and transit speed data • Logical hierarchy • Balance highway and transit • Terminal times • Logical hierarchy • Phase I Report
Recommended Guidelines and StandardsTrip Generation • Aggregate trip rates • Person trips/TAZ • Person trips/person • Person trips/DU (or HH) • HBW person trips/employee • Total unbalanced attractions versus productionsby purpose • Preferred +/-10%; acceptable in some instances +/-50% • Percent external-external trips by zone/station • Great variation expected (4-21 percent range documented) a Generally excludes nonmotorized trips; including motorized trips could increase person trips per DU up to 11.5.
Recommended Guidelines and StandardsTrip Generation (continued) • Percent trips by purpose a HBO includes a variety of special trip purposes depending on the model (e.g., airport, college, and shop). b HBNW accounts for all home-based trip purposes except HBW. c NHB includes combined purposes for NHB Work and NHB Nonwork, where appropriate.
Recommended Guidelines and StandardsTrip Distribution • Average trip length by purpose • Trip length frequency distributions by purpose • Coincidence ratios by purpose – measures the percent of areathat coincides for two triplength frequencies Percent of Total Trips 8% a HBO includes a variety of special trip purposes, depending on the model (e.g., airport, college, and school). b NHB includes combined purposes for NHB Work and NHB Nonwork, where appropriate. c Some lower coincidence ratios have been deemed acceptable for trip purposes that had relatively few trips and therefore higher error rates. Coincidence Ratio = 0.82 Estimated (ATL = 18.2 Min) 6% Observed (ATL = 18.9 Min) 4% 2% 0% 0 10 20 30 40 50 60 Travel Time (in Minutes)
Recommended Guidelines and StandardsTrip Distribution (continued) • Percent intrazonal trips by purpose • Map-based (“node-point”) charts • Zone-based • Number of trips • Trip productions/attractionsby purpose a HBO includes a variety of special trip purposes, depending on the model (e.g., airport, college, and school). b NHB includes combined purposes for NHB Work and NHB Nonwork, where appropriate.
Recommended Guidelines and StandardsMode Choice • Mode split targets (ideal) • Trip purpose • Mode • Auto ownership level • Geographic subarea
Recommended Guidelines and StandardsMode Choice (continued) • Mode splits by observed calibration targets • Total area transit trips, estimatedversus observed • Transit trips between districts • Tabular comparisons (CTPP) • Desire lines • Mean trip length, estimated transit trips versus observed
Recommended Guidelines and StandardsTrip Assignment • Volume-over-count ratios • +/-1 lane percent error (calculated based on FDOT LOS Handbook) • Aggregate VMT • VMT/HH (60-75) • VMT/person (24-32) • VMT/commercial vehicle (3-25%)
Recommended Guidelines and StandardsTrip Assignment (continued) • Screenline volume-over-count • By volume and location • RMSE by volume group • Transit assignment validation
Calibration and Validation Best PracticesSteps in Model Validation and Calibration Process • Iterative process • Process must acknowledge • Availability of behavioral data (or lack thereof) • Variability in data accuracy • Regional issues to be evaluated with the model • Need for future year sensitivity testing • Must validate each step (i.e., not just assignment) SecondaryDataCollection InstitutionalFramework Initiate Inventory PrimaryDataCollection DataChecking ModelEstimation ModelImplementation Iterate ModelCalibration ModelValidation NO ModelApplication Satisfactory Results? YES Continual ModelMaintenance, Application
Calibration and Validation Best PracticesGuidance on Validation and Adjustment Validation and Reasonableness Checks Estimation Calibration Validation Application Iterate Iterate Iterate • Matching base year statistics is not sufficient to say model is validated • Ideal combination of skills • Local area knowledge • Familiarity with sources for transferable parameters • Understanding of whatconstitutes acceptable results • Experience with cause and effect of model adjustments • Quality and availability of data
Calibration and Validation Best Practices Special Validation Considerations Statewide Model Statewide Model Statewide Model Study Area Study Area Urban Model Area 2 Study Area Urban Model Area Study Area Urban Model Area 1 Urban Model Area Study Area Within One Model Area Study Areas Within Two Model Areas Study Area Outside Urban Model Areas • Requirements bystudy type • FTA New Startsprojects • Subarea and corridorvalidation • Site impact studies • Other validation practices • Adjustment of congestedspeeds • Use of special generators • Transferable parameters • Impact of new paradigms Example of Coding Penalties for HOV Lanes General Purpose Lanes HOV Lanes General Purpose Lanes Example of Coding Prohibitors for Proper Access Would not cross traffic to take loop ramp Cannot cross median to access driveway (centroid connector) Red lines represent penalized or prohibited movements.
Guidelines for Model ApplicationsStability of Model Parameters • Static versus dynamic parameter settings • Generally “locked down” during validation • Limited trend data to back up values for future years • History has shown changes in… • Nonhome-based trip rates • Trip length frequencies • Auto occupancy rates • BPR curves
Guidelines for Model ApplicationsTypical Model Applications and Guidelines • MPO LRTP Updates • Comprehensive Plans • SIS/FIHS Planning • Campus Master Plans • Concurrency Applications • Development of Regional Impacts (DRIs) • Congestion Management Systems • Air Quality and Climate Change • Corridor Studies • Corridor Feasibility Studies; • FTA New Starts/Small Starts Applications; • Project Development and Environment (PD&E) Studies; • Interstate Master Plans; • Interchange Justification/Modification Reports (IJR/IMR); and • Toll Feasibility Studies. • Developed list of 14 different model application types and relevant model guidance unique to each (e.g., forecasting external trips for MPO LRTP Updates, etc.) • Acknowledge uncertainty in forecasting process
Guidelines for Model Applications Model Application Checks • Review logic of demographic forecasts at regionand subarea • Generate color-coded plots of highway network characteristics • Compare base and future year trip productions and attractions by purpose at the regional and subarea level • Compare base and future year trip distribution patterns • Review logic of changes in mode splits resulting from scenario testing that would seemingly benefit one mode over another • Compare traffic estimates on specific corridors and screenlines between base and future years and buildand no-build conditions
Next Steps • FDOT is conducting peer review of Final Report • Validation checklist and new standards being tested to • Review/comment on recent validation studies • Ratchet up expectations for ongoing validation studies