Download
1 / 19
190 likes | 293 Vues
Here is our now familiar graph with 2 regions trading 1 good. International Market. MS. FL. Now let’s draw the Export Supply and Import Demand curves. International Market. MS. FL. Just for the sake of argument, suppose that p FL prevailed in MS.

E N D
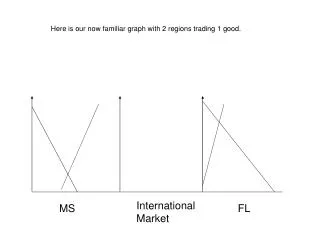
Here is our now familiar graph with 2 regions trading 1 good. International Market MS FL
Now let’s draw the Export Supply and Import Demand curves. International Market MS FL
Just for the sake of argument, suppose that pFL prevailed in MS. Then MS supplier would produce more than MS consumers would want to buy. That difference in quantity would then be offered on the International Market. pFL pMS International Market MS FL
We need to figure out (graphically) how big that quantity is. pFL pMS International Market MS FL
It would correspond to the thick segment in the left graph below. pFL pMS International Market MS FL
We report that segment in the center graph. pFL pMS International Market MS FL
Of course, if pMS were to prevail in MS, then domestic consumption would equal domestic supply and export would be zero. We thus now have two points to draw MS’s export supply curve. pFL pMS International Market MS FL
One point is here… pFL pMS International Market MS FL
…and the other one is there. pFL pMS International Market MS FL
Now let’s draw the export supply curve. pFL pMS International Market MS FL
OK. We can go ahead and remove the thick lines and the two points. They’ve served their purpose. pFL pMS International Market MS FL
We now repeat the same exercise to plot the import demand curve, so let’s look at Florida. pFL pMS International Market MS FL
If pFL prevails in Florida, then FL will not import anything, as represented by the point. pFL pMS International Market MS FL
If pMS were to prevail in Florida, then FL would import a quantity corresponding to the thick segment. pFL pMS International Market MS FL
Report that segment in the international market and you get a second point with which to plot the import demand curve. pFL pMS International Market MS FL
Report that segment in the international market and you get a second point with which to plot the import demand curve. pFL pMS International Market MS FL
Let’s clean up and remove the thick line and the dots. They are now just in the way. pFL pMS International Market MS FL
The intersection of the export supply and import demand curves reveals the “World Market” price, pW. pFL pW pMS International Market MS FL
That’s all folks! pW International Market MS FL