Prediction in Road Safety
150 likes | 341 Vues
Prediction in Road Safety. 1. What is Prediction and When is it Needed?. a. When setting safety targets, predict what would be safety in the future if no new initiatives will be taken.

Prediction in Road Safety
E N D
Presentation Transcript
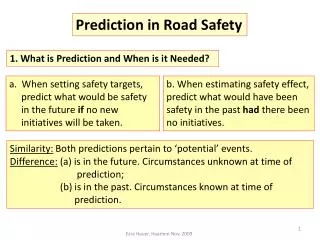
Prediction in Road Safety 1. What is Prediction and When is it Needed? a. When setting safety targets, predict what would be safety in the future if no new initiatives will be taken. b. When estimating safety effect, predict what would have been safety in the past had there been no initiatives. Similarity: Both predictions pertain to ‘potential’ events. Difference: (a) is in the future. Circumstances unknown at time of prediction; (b) is in the past. Circumstances known at time of prediction. Ezra Hauer, Haarlem Nov. 2009
Illustration: New safety targets set by CCMTA in October 2000 (Vision 2010). What would safety in the future be if no new initiatives taken? If straight line then P for 2010 is about 1800 Haarlem Nov. 2009
What would safety in the future be if no new initiatives taken? If exponential then P for 2010 is about 2000 Problem: There are many ways to predict and even more predictions, Which prediction to choose? Haarlem Nov. 2009
The CCMTA (October 2000): “The national target calls for a 30% decrease in the average number of road users killed and seriously injured during the 2008-2010 period over comparable 1996-2001 figures. … Achievement of these targets would reduce Canada’s road fatality total to fewer than 2,100 by 2010.” But, where is the prediction in this? Haarlem Nov. 2009
2. Same Data, Different Predictions, Which is best? Suppose that I am at the end of 1985 and want to predict for the next 10 years Haarlem Nov. 2009
Alternative Methods of Prediction 1. Straight Line 2. Second degree polynomial Haarlem Nov. 2009
More Methods of Prediction 3. Hoerl Function 4. Holt Smoothing, 5. Oppe-Koornstra model Which is best? Haarlem Nov. 2009
3.How to Measure Prediction Quality OLS, Linear Predictions for 10 years following 1985 OLS, Linear Predictions for 10 years following 1984 Haarlem Nov. 2009
The Basis idea: Judge the quality of a prediction method by how it would have performed had it been used in the past. n=5 d, relative differences 44 rows Attributes of prediction quality Haarlem Nov. 2009
4. Now some questions can be answered Q1: If (for Saskatchewan) prediction is by OLS then what n is best? Haarlem Nov. 2009
A1: If (for Saskatchewan) prediction is by OLS then n=10 is best? Haarlem Nov. 2009
Q2: For Saskatchewan, is OLS better than QLS? OLS QLS Haarlem Nov. 2009
Results for two Provinces: For Saskatchewan, Hoerl Function with n=10 and 19 best; For Ontario, Linear (n=10), Holt (A) and Hoerl (n=12) were best 5. Summary and Discussion a. Prediction is not estimation nor curve fitting; it is about ‘what will happen if’ or ‘what would have happened if’ b. To say which of two prediction methods is better one has to have a yardstick for quality. I suggested to compute how the two methods would have performed in the past, had they been used and to compare their Haarlem Nov. 2009
c. Broad Conclusions will emerge only after the approach will be applied to many data sets and tried with many methods of prediction. Haarlem Nov. 2009