Telephone Interviews on Health: Response Rates and Classification of Well-being
10 likes | 121 Vues
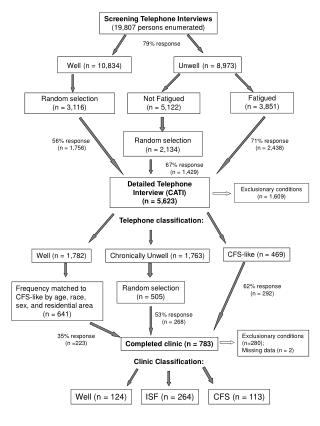
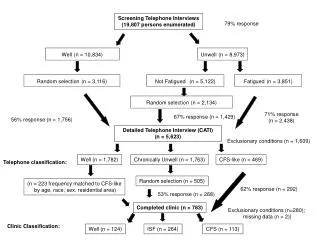
This study involved screening 19,807 individuals through telephone interviews, achieving a 79% response rate. Participants were categorized into two groups: well (n=10,834) and unwell (n=8,973), with further analysis separating fatigued individuals (n=3,851) from those not fatigued (n=5,122). A detailed CATI approach was employed involving 5,623 participants, with different responses observed among various classified health conditions. The data sheds light on the prevalence of chronic fatigue syndrome and the classification of participants amidst exclusionary conditions.

Telephone Interviews on Health: Response Rates and Classification of Well-being
E N D
Presentation Transcript
Screening Telephone Interviews (19,807 persons enumerated) 79% response Well(n = 10,834) Unwell(n = 8,973) Random selection(n = 3,116) Not Fatigued(n = 5,122) Fatigued(n = 3,851) Random selection(n = 2,134) 71% response (n = 2,438) 67% response (n = 1,429) 56% response (n = 1,756) Detailed Telephone Interview (CATI) (n = 5,623) Exclusionary conditions (n = 1,609) Well (n = 1,782) Chronically Unwell (n = 1,763) CFS-like (n = 469) Telephone classification: Random selection (n = 505) (n = 223 frequency matched to CFS-like by age, race, sex, residential area) 62% response (n = 292) 53% response (n = 268) Completed clinic (n = 783) Exclusionary conditions (n=280); missing data (n = 2)) Clinic Classification: Well (n = 124) ISF (n = 264) CFS (n = 113)