Verification of Flash Flood Warnings
280 likes | 484 Vues
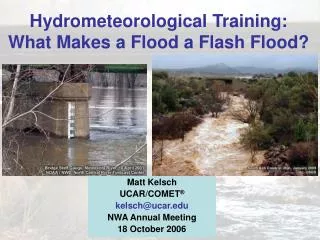
Verification of Flash Flood Warnings. Brent MacAloney Meteorologist, Performance Branch Silver Spring, MD. On Tap Today…. Historical Flash Flood Verification Developing a scheme for storm-based flash flood warnings How storm-based warnings are verified Upcoming changes to verification

Verification of Flash Flood Warnings
E N D
Presentation Transcript
Verification of Flash Flood Warnings Brent MacAloney Meteorologist, Performance Branch Silver Spring, MD
On Tap Today…. • Historical Flash Flood Verification • Developing a scheme for storm-based flash flood warnings • How storm-based warnings are verified • Upcoming changes to verification • Next-Generation Storm Data Program
Verification data back to 1986 Verifying events from storm data GPRA metric until FY10 County-based verification One report in warned county, regardless of if in polygon verifies warning Historical Flash Flood Verification
County-based Verification unwarned unwarned unwarned unwarned unwarned
Developing Storm-based FFW Verification • NWS begins issuing storm-based warnings in October 2007 for SVR, TOR, FFW, and SMW products • Needed way to measure performance since county-based methodology no longer applied. • Team formed to develop new performance metrics • Met in Boulder in December 2005
How Storm-based FFWs are Verified • Information used from warning products • Beginning date / time (VTEC) • Ending date / time (VTEC) • Forecast office • Action Code (NEW or EXT) • Event Tracking Number (ETN) • Area from latitude/longitude
How Storm-based FFWs are Verified • Information used from events • Beginning date / time • Ending date / time • Forecast office • Area from latitude/longitude points outlining flooded area
How Storm-based FFWs are Verified • First step: Check if the warning verified • Did a flash flood event occur within the area and time of the warning? • Yes, warning is verified. • No, warning is unverified UNVERIFIED VERIFIED
How Storm-based FFWs are Verified • Second step: Calculate percent of event warned (PEW) • Was there a flash flood warning valid for the area and time in which the event occurred? • Yes, event is fully warned, PEW = 1 • Partially, event is partially warned, PEW between 0 - 1 • No, event is unwarned, PEW = 0
How Storm-based FFWs are Verified • Third step: Calculate event maximum event lead time • Was there a flash flood warning valid any area of the event at the time in which the event occurred? • Yes, lead time > 0 • No, lead time = 0 • Note: Maximum event lead time calculation does not take into account how much of event was covered by a warning.
Event with maximum event lead time > 0 • Maximum event lead time = 7 minutes
Event with maximum event lead time > 0 • Maximum event lead time = 119 minutes
Event with no maximum event lead time • Maximum event lead time = 0 minutes
How Storm-based FFWs are Verified • Fourth step: Calculate event area weighted lead time • Was there a flash flood warning valid at the time in which the event occurred? • Yes • Did the warning cover the entire area of the event? • Yes, lead time > 0 • No, deduction taken on lead time for area not warned • No, lead time = 0
Event with area weighted lead time > 0 • Area weighted lead time = 7 minutes
Event with area weighted lead time > 0 • Area weighted lead time = 69 minutes
Event with no area weighted lead time • Area weighted lead time = 0 minutes
Difference between area weighted and maximum event lead times Area LT = 69 minutes Max LT = 119 minutes Which best shows our performance?
Verification data back to October 2007 Verifying events from storm data GPRA metric since FY10 Storm-based Flash Flood Verification
Storm data currently being modernized Beginning with data in October 2010 Changes will impact verification of flash floods Changes to Verification
Change to how events are entered Problem – “Events in storm data are broken into county-based segments.
Change to how events are entered Solution – Eliminate the need to enter events into county-based events All county-based events will be able to be entered “as they occurred” and won’t have to be broken up into county-based segments. • Biggest impact to tornado, hail, thunderstorm wind, flash flood and flood
Change to how events are entered • Benefit of eliminating county-boundaries: • More accurate reporting of events • Easier entry into storm data • Saves a lot of entry time
Thank you for your time!Feel free to contact me…. Brent MacAloney E-mail: Brent.MacAloney@noaa.gov Phone: 301-713-0090 x135