Population Trends in the US: Impact on Education and Economy
650 likes | 675 Vues
Explore the implications of population change in the United States for education, labor force, and economic development. This study by Steve H. Murdock, Director of the Hobby Center for the Study of Texas, analyzes population shifts from 1850 to 2010, providing insights into future trends and challenges. Discover the components of change in both the US and Texas from 2000 to 2009, including population growth in major cities. The analysis also delves into demographic changes by race and ethnicity, highlighting variations in population distribution over time. Gain valuable insights into how these demographic shifts affect metropolitan and non-metropolitan areas, as well as age groups. Learn about the projected population characteristics and socioeconomic conditions up to 2040, offering a comprehensive view of the evolving population landscape. Delve into data on poverty rates, median household income, and demographic compositions, providing a nuanced understanding of societal dynamics. Stay informed about the evolving population dynamics and their far-reaching effects on various sectors.

Population Trends in the US: Impact on Education and Economy
E N D
Presentation Transcript
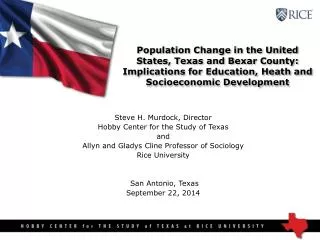
Population Change in the United States: Implications for Education, the Labor Force and Economic Development Steve H. Murdock, DirectorHobby Center for the Study of Texasand Allyn and Gladys Cline Professor of SociologyRice University Future of State Universities Conference Dallas ,Texas October 6, 2011 Hobby Center for the Study of Texas at Rice University
Total Population and Percent Population Changein Texas and the United States, 1850-2010 Hobby Center for the Study of Texas at Rice University
Population 2000 and 2010 and Population Change 2000-2010 for the Ten Most Populous Incorporated Places in the United States
Population, Population Change, and Proportion of the Total Population by Race/Ethnicity for the United States, 2000 and 2010 *Hispanic includes persons of all races. All other race/ethnicity categories shown here are Non-Hispanic. Non-Hispanic Other includes persons identifying themselves as Non-Hispanic American Indian or Alaska Native, Non-Hispanic Native Hawaiian or Pacific Islander, Non-Hispanic Some Other Race, or Non-Hispanic and a combination of two or more races. Source: U.S. Census 2000 & 2010, P.L. 94-171 Prepared by the Hobby Center for the Study of Texas at Rice University http://HobbyCenter.Rice.edu
Population, Population Change, and Proportion of the Population Under Age 18 by Race/Ethnicity for the United States, 2000 and 2010 *Hispanic includes persons of all races. All other race/ethnicity categories shown here are Non-Hispanic. Non-Hispanic Other includes persons identifying themselves as Non-Hispanic American Indian or Alaska Native, Non-Hispanic Native Hawaiian or Pacific Islander, Non-Hispanic Some Other Race, or Non-Hispanic and a combination of two or more races. Source: U.S. Census 2000 & 2010, P.L. 94-171 Prepared by the Hobby Center for the Study of Texas at Rice University http://HobbyCenter.Rice.edu
Population, Population Change, and Proportion of the Population Under Age 18 by Race/Ethnicity for Metropolitan Central City Counties in the United States, 2000 and 2010 *Hispanic includes persons of all races. All other race/ethnicity categories shown here are Non-Hispanic. Non-Hispanic Other includes persons identifying themselves as Non-Hispanic American Indian or Alaska Native, Non-Hispanic Native Hawaiian or Pacific Islander, Non-Hispanic Some Other Race, or Non-Hispanic and a combination of two or more races. Source: U.S. Census 2000 & 2010, P.L. 94-171 Prepared by the Hobby Center for the Study of Texas at Rice University http://HobbyCenter.Rice.edu
Population, Population Change, and Proportion of the Population Under Age 18 by Race/Ethnicity for Metropolitan Suburban Counties In the United States, 2000 and 2010 *Hispanic includes persons of all races. All other race/ethnicity categories shown here are Non-Hispanic. Non-Hispanic Other includes persons identifying themselves as Non-Hispanic American Indian or Alaska Native, Non-Hispanic Native Hawaiian or Pacific Islander, Non-Hispanic Some Other Race, or Non-Hispanic and a combination of two or more races. Source: U.S. Census 2000 & 2010, P.L. 94-171 Prepared by the Hobby Center for the Study of Texas at Rice University http://HobbyCenter.Rice.edu
Population, Population Change, and Proportion of the Population Under Age 18 by Race/Ethnicity for Non-Metropolitan Counties in the United States, 2000 and 2010 *Hispanic includes persons of all races. All other race/ethnicity categories shown here are Non-Hispanic. Non-Hispanic Other includes persons identifying themselves as Non-Hispanic American Indian or Alaska Native, Non-Hispanic Native Hawaiian or Pacific Islander, Non-Hispanic Some Other Race, or Non-Hispanic and a combination of two or more races. Source: U.S. Census 2000 & 2010, P.L. 94-171 Prepared by the Hobby Center for the Study of Texas at Rice University http://HobbyCenter.Rice.edu
Percent of Texas Population by Age Groupand Ethnicity, 2000 Hobby Center for the Study of Texas at Rice University
Percent of Texas Population by Age Group and Ethnicity, 2010 Hobby Center for the Study of Texas at Rice University
Percent of Texas Population by Age Groupand Ethnicity, 2040* Hobby Center for the Study of Texas at Rice University
Percent of United States Population by Age Group and Ethnicity, 2000 Hobby Center for the Study of Texas at Rice University
Percent of United States Population by Age Group and Ethnicity, 2050 Hobby Center for the Study of Texas at Rice University
POPULATION CHARACTERISTICS AND SOCIOECONOMIC CONDITIONS Hobby Center for the Study of Texas at Rice University
Total and Percent of the United States Population in Poverty and Median Household Income by Race/Ethnicity, 1999 and 2009 *In 2009 Dollars Source: U.S. Census Bureau, Census 2000 and American Community Survey, 2009 Hobby Center for the Study of Texas at Rice University
Educational Attainment for the United States Population Age 25 and Older by Race/Ethnicity, 2010
Average (Mean) SAT Scores for College Bound Seniors in the United States in 2001 by Selected Characteristics Hobby Center for the Study of Texas at Rice University
PROJECTIONS Hobby Center for the Study of Texas at Rice University
Projections of the U.S. Population by Race and Hispanic Origin: 2000 to 2050 Hobby Center for the Study of Texas at Rice University
Numeric Change in the Projected U.S. Population by Race and Hispanic Origin: 2000 to 2050 (in millions) Hobby Center for the Study of Texas at Rice University
Projected Change in the U.S. Population by Race and Hispanic Origin: 2000 to 2050
Projected Age Distribution of the U.S. Population: 2000 to 2050 Hobby Center for the Study of Texas at Rice University
Percent Race and Hispanic Origin Distribution of the U.S. Population by Selected Age Groups: 2000 Hobby Center for the Study of Texas at Rice University
Projected Percent Race and Hispanic Origin Distribution of the U.S. Population by Selected Age Groups: 2050 Hobby Center for the Study of Texas at Rice University
Population, Population Change, and Proportion of the Total Population by Race/Ethnicity for the State of Texas, 2000 and 2010
Population, Population Change, and Proportion of the Population Less than 18 Years of Age by Race/Ethnicity for Texas, 2000 and 2010
Population in Texas by Race/Ethnicity in 2000 and Projections of the Population in Texas by Race/Ethnicity from 2010 to 2040
Percent of Population in Texas by Race/Ethnicity in 2000 and Projections of the Population in Texas by Race/Ethnicity from 2010 to 2040
Percent of Population by Age Group and Race/Ethnicity in 2000 andProjected Percent of Population by Age and Race/Ethnicity from2020 to 2040 for Texas Under Alternative Scenarios of Age/Sex andRace/Ethnicity-Specific Net Migration
Total and Percent of the Texas Population in Poverty and Median Household Income by Race/Ethnicity, 1999 and 2009 *In 2009 Dollars Source: U.S. Census Bureau, Census 2000 and American Community Survey, 2009
Educational Attainment for the Texas Population Age 25 and Older by Race/Ethnicity, 2010
Projected Elementary and Secondary School, Community College and Public University Enrollmentin the United States by Race/Ethnicity, 2000-2050
Percent of Projected Elementary and Secondary School, Community College and Public University Enrollmentin the United States by Race/Ethnicity, 2000-2050
Percent of Net Change in Elementary and Secondary School, Community College and Public University Enrollment in theUnited States Due to Each Race/Ethnicity, 2000-2050
TEXAS EDUCATION Hobby Center for the Study of Texas at Rice University
Enrollment and Change in Enrollment of Economically Disadvantaged and All Students by Ethnicity in Texas Public Schools, 1999-2000 and 2009-2010 School Years
Total Public School Students by Race/Ethnicity in the 10 Largest* School Districts in Texas, 2000-2001 and 2010-2011 *Largest enrollment based on 2010-2011 school year Source: Data compiled by the Texas State Data Center from Texas Education Agency, Academic Excellence Indicator System (AEIS) District Profiles
Texas Higher Education Enrollment in Public Universities, Public 2-year Colleges andHealth-related Institutions by Race/Ethnicity, 2000 and 2008 Source: Data compiled by the Texas State Data Center using data from the Texas Higher Education Coordinating Board (THECB)
Public Elementary and Secondary Public CommunityCollege, and Public University Enrollment in Texas byRace/Ethnicity in 2000 and Projections to 2040 AssumingRates of Net Migration Equal to 1990-2000 (1.0 Scenario)
Percent of Public Elementary and Secondary, PublicCommunity College and Public University Enrollment in Texasby Race/Ethnicity in 2000 and Projections to 2040 AssumingRates of Net Migration Equal to 1990-2000 (1.0 Scenario)