Reflex: Experiment with Filters for Enhanced Data Visualization
Discover how Reflex allows for easy experimentation with filters on raw data to enhance visualization before saving the results. Learn how to manipulate and analyze data visually through different palettes and 3D modules. Export single time slices for detailed analysis and further visualize in Voxler for 3D visualizations. This tool empowers users to bring out important features in their data display by utilizing various processing techniques.

Reflex: Experiment with Filters for Enhanced Data Visualization
E N D
Presentation Transcript
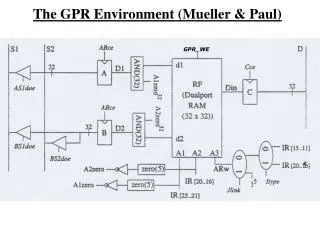
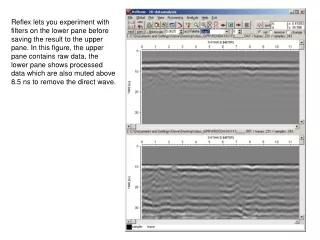
Reflex lets you experiment with filters on the lower pane before saving the result to the upper pane. In this figure, the upper pane contains raw data, the lower pane shows processed data which are also muted above 8.5 ns to remove the direct wave.
In Reflex, it is always worth scrolling through the various palettes as different features are more, or less, noticeable on different palettes.
After 2D processing each line, or processing one line and then using the batch mode, the 3D module lets you lay out all the profiles.
The 3D cube lets you scroll though any of the three coordinate directions and build figures with selected slices.
Reflex lets you export ‘single time slices’ which average the envelope over time. This is generally the best way to bring out features in single image displays. However, generating meaningful time slices takes some care and experimentation. Here, the upper image is averaged over 9-12 ns, and the lower image is averaged over 8-12 ns.
Exporting ASCII data from Reflex allows you to import those {x, y, z, value} data into Voxler for further 3D visualizations. In Voxler, images usually work best if you use a Surfer worksheet to calculate a column of absolute values of the amplitudes. You can also make mpegs in Reflex or capture video of Voxler animations.