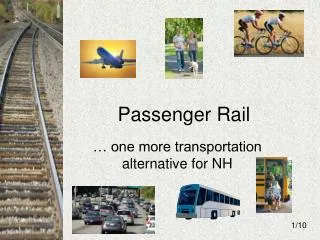
Passenger Traffic 2000 2020
This analysis reviews passenger and freight traffic trends across road, rail, and air transportation in Europe from 2000 to 2020, highlighting significant growth rates and the pressing need for infrastructure improvements. While passenger road traffic grew by 67%, air travel surged by 133%, freight transportation via road rose by 136%, underscoring an overall increase in demand. The report emphasizes the necessity for focused investment in key infrastructure projects, especially in railway and maritime transport, amidst shrinking EU funding relative to GDP.

Passenger Traffic 2000 2020
E N D
Presentation Transcript
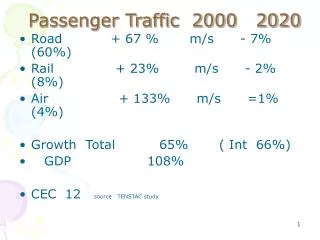
Passenger Traffic 2000 2020 • Road + 67 % m/s - 7% (60%) • Rail + 23% m/s - 2% (8%) • Air + 133% m/s =1% (4%) • Growth Total 65% ( Int 66%) • GDP 108% • CEC 12 source TENSTAC study
Freight traffic • Road +136% ms + 10%(58%) • Rail +89% ms -11% (39%) • IW +157% ms +1% (3%) • Total +95% • GDP + 108%
The Current state of TENs • Need for change: • Failure to make progress on the priority projects . • Entry of new Member States . • Widen the geographical coverage but • Concentrate on a limited number of major routes.
Priority projects – 30 located on major axes and covering the 25 m/s plus Bulgaria and Rumania. • The 30 projects represent an investment of 225 B € up to 2020. • The complete network would require 600 B € up to 2020 . • Focus on rail and maritime transport including the new concept of the Motorways of the Sea.
Guidelines revised to allow up to 20% to be given in financial support-notably for cross- border sections. • Designation of ‘European Coordinators for certain major cross- border projects. • Funding problems : EU 15 in the past devoted 1.5% of GDP now less than 1% when traffic is increasing.
For the future • Better links to the EU’s new neighbours • Improvement of planning arrangements. • Funding . Less than 1% of GDP is invested in infrastructure. • EU support programmes : • CARDS – Western Balkans. • TACIS –Eastern Europe and Central Asia. • MEDA – Euro- Mediterranean Pertnership.
Conclusions • Identified a number of major trans-national axes. • 3O specific projects on these axes. • High level group established to identify jointly priority projects linking to neighbouring countries.