Download
1 / 43
440 likes | 587 Vues
Halogen Oxides in the Troposphere measurements, distributions, and impacts Lecture at the ERCA 2008 Grenoble, January 14, 2008 Andreas Richter Institute of Environmental Physics University of Bremen Bremen, Germany ( richter@iup.physik.uni-bremen.de ). Overview. Introduction

E N D
Halogen Oxides in the Troposphere measurements, distributions, and impacts Lecture at the ERCA 2008 Grenoble, January 14, 2008 Andreas Richter Institute of Environmental Physics University of Bremen Bremen, Germany ( richter@iup.physik.uni-bremen.de )
Overview • Introduction • Reminder: Stratospheric Halogen Chemistry • Some Tropospheric Halogen Chemistry • Polar Ozone Depletion Events • Salt Lakes • The marine Boundary Layer • Halogen Emissions from Volcanoes • BrO in the free Troposphere • Iodine and Particle Formation • Iodine in the Polar Troposphere • Summary
http://seaweed.ucg.ie www.gdargaud.net/Climbing/AntarClimb.html Halogen Oxides in the Troposphere
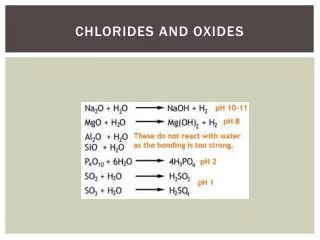
Stratospheric Ozone Chemistry Halogens can also act as catalysts • sources: • anthropogenic (CFCs, CH3Br) • natural (CH3Br) • sinks: • reservoir species (e.g. HCl, ClONO2) • sedimentation => slow ozone depletion at high altitudes, mainly through Cl • F all bound in HF • Br and I more reactive but much lower concentrationsCly~ 3.5ppb, Bry ~ 16ppt, Iy < 1ppt • Chapman cycle O2 + hν→ O(3P) + O(3P) O + O2 + M → O3 + M O3 + hν→ O2 + O(1D) O + O3 → 2 O2 => too large ozone columns! • Catalytic ozone loss (HOx, NOx) XO + O3→ XO2 + O2 XO2 + O → XO + O2 net: O3 + O → 2 O2 => good agreement with measurements
ClO dimer cycle ClO + ClO + M→ ClOOCl + M ClOOCl + hν→ ClOO + Cl ClOO + M → Cl + O2 2(O3 + Cl → ClO + O2) net: 2O3→ 3O2 ClO - BrO cycle O3 + Cl → ClO + O2 O3 + Br → BrO + O2 ClO + BrO → Cl + Br + O2 net: 2O3→ 3O2 Stratospheric Ozone Hole • at very low temperatures. PSCs can form • they consist of ice, HNO3, H2SO4 • at their surface heterogeneous reactions take place • inactive halogen reservoirs are converted into reactive forms • rapid non-linear ozone loss in the lower stratosphere in polar spring at low temperatures
Ozone loss with cross-reactions: X + O3 → XO + O2 Y + O3 → YO + O2 XO + YO → X + Y + O2 net: 2O3→ 3O2 Ozone loss at high BrO: 2(Br + O3 → BrO + O2) BrO + BrO → 2 Br + O2 BrO + BrO → Br2+ O2 Br2 + hν→ 2Br net: 2O3→ 3O2 Ozone loss with HO2 and CO: O3 + X → XO + O2 XO + HO2 → HOX + O2 HOX + hν→ X + OH OH + CO ( + O2) → CO2 + HO2 net: CO + O3→ CO2 + O2 Halogens and tropospheric Ozone X, Y = Cl, Br, I • Release: • by photolysis of • X2 or XY • HOX, XONO2, XNO2 • organic halogens Main Sinks: XO + NO2 → XONO2 XONO2 → XO + NO2XONO2 + hν→ X + NO3XONO2 + H2O → HOX + HNO3 Cl + RH → HCl + R O3 + X→ XO + O2 XO + hν(+O2 + M) → X + O3 IO + IO also possible BrO + ClO is faster than BrO + BrO
O3 and HOx needed! Release with Br only: Br2 + hν→ 2Br 2(Br + O3 → BrO + O2) 2(BrO + HO2 → HOBr + O2) 2 HOBr → 2HOBraq 2(HOBraq + H+ + Br - → Br2, aq + H2O) 2 Br2, aq → 2 Br2 net: 2O3 + 2HO2 + 2Br - + 2H+→ Br2 + 4O2 + 2H2O Release with Br and Cl: BrCl + hν→ Br + Cl Br + O3 → BrO + O2 BrO + HO2 → HOBr + O2 HOBr → HOBraq HOBraq + H+ + Cl - → BrClaq + H2O BrClaq + Br - ↔ Br2Cl - Br2Cl -↔ Br2,aq + Cl - Br2, aq ↔ Br2 net: BrCl + O3 + HO2 + Br - + H+→ Cl + Br2 + 2O2 + H2O acidcatalyzed Autocatalytic Release – one Br less into condensed phase than out! => once started, Br2 will increase exponentially until reservoir is empty, O3 is gone or loss processes exceed production: Bromine Explosion Release of Halogens from Salt Deposits / Salt Aerosols I (also works with BrCl instead of Br2)
Release of Halogens from Salt Deposits / Salt Aerosols II Comments: • autocatalytic release works only for BrO • uptake of HOBr and release of Br2 and BrCl have been observed in the lab from dry salt crystals, aqueous salt solutions, aerosols, and halide ice surfaces • over ice, release does not depend on pH but on temperature • start-up needed for initial Br2 release • in the condensed phase, HOI can also have similar reactions as HOBr • in the presence of NOx, N2O5 can be taken up and halogen nitrites (XNO2) be released (works in the dark) • in the presence of NOx, halogen nitrates (XONO2) can also be taken up and lead to release of X2 and XY without acid catalysis • higher oxides are of atmospheric relevance for Iodine only • sea water content: ratios [Cl] / [Br] = 660, [Br] / [ I] = 15000
Figure courtesy W. Simpson Snow No snow Snow Ozone Depletion in the Polar Boundary Layer • Each spring, episodes of severe ozone depletion (ODE) are observed in both hemispheres at thesurface: • Over sea-ice, full depletion is the standard situation, at some coastal stations (e.g. Barrow) they are frequent, at others (e.g. Ny-Ålesund) rare. • At coastal stations, ODEs are linked to air parcel origins over sea-ice • ODEs are usually correlated with low temperatures.
The link between Ozone Depletion and Bromine • During ODEs, filterable bromine is much enhanced Barrie L. A., et al., , Ozone destruction and photochemical reactions at polar sunrise in the lower Arctic atmosphere. Nature 334, 138–141, 1988 • with long-path DOAS, up to 20 ppt of BrO could be detected close to the ground during ozone depletion events in Ny-Ålesund Hausmann M. and Platt U. Spectroscopic measurement of bromine oxide and ozone in the high Arctic during Polar Sunrise Experiment 1992. J. Geophys. Res. 99, 25399–25413., 1994
Ozone Depletion in the Polar Boundary Layer Vertical extension: • the vertical extent of the ozone depletion varies but usually coincides with the arctic inversion layer • over Antarctica, elevated layers of depleted ozone have been observed as result of upward transport of depleted air masses from the ice • BrO is often located close to the ground, but some DOAS measurements of BrO layers at larger altitude have also been reported Time scales: • ozone depletion at coastal sites often occurs very rapidly but this is frequently linked to change in wind directions • models predict ozone depletion to take many hours • recently, observations on the Polarstern showed much faster O3 depletion without change in wind direction
Satellite Observations of Polar BrO • UV absorption spectroscopy of scattered sun-light • Differential Optical Absorption Spectroscopy (DOAS) measurements • several satellite instruments: • Global Ozone Monitoring Experiment (GOME) (1996 – 2002 - ...) • and Scanning Imaging Absorption Spectrometer for Atmospheric CartograpHY (SCIAMACHY) (2002 – today) • OMI (2004 – today) • GOME-2 (March 2006 – today) • BrO events cover large area each spring in both hemispheres • individual events can be followed for several days • largest values are observed along the coasts and over sea-ice • the same areas are covered each year • high altitude snow covered regions (Antarctica, Greenland are not affected
Time Series of BrO Columns April, NH GOME SCIA
Time Series of BrO Columns September, SH GOME SCIA
A BrO Explosion Event March /April 2007 Case Study: • GOME-2 BrO columns • large plume of elevated BrO forms • plume “lives” for more than 10 days • long-range transport from the Arctic towards Hudson Bay • plume evolution not in line with general wind pattern => is this transport or chemical evolution? => is this typical or an unusual event?
What are the Active Surfaces? The source of halogens are sea salt, but how are they released? • photolysis of biogenic precursors (too slow, not enough ?) • sea salt aerosol (not enough Br ?) • from first year ice (still salty) • from snow-pack (salt deposited by aerosols) • from frost flowers (highly saline quasi-liquid layer) • from Br enriched aerosols formed from frost flowers or wind blown snow
zenith-sky DOAS geometry The Link to Sea Ice stratosphere free troposphereboundary layer • from backward trajectories, it is evident that enhanced BrO and reduced O3 is found when air masses had contact with new sea ice • this has been shown for both hemispheres • correlation is best if first year sea-ice is used Frieß, U. et al., Dynamics and chemistry of tropospheric bromine explosion events in the Antarctic coastal region, J. Geophys. Res., 109, D06305, doi:10.1029/2003JD004133, 2004
The Link to Frost Flowers • Frost flowers form on fresh ice at very low temperatures • They offer large surface area and high salinity • Areas of potential frost flower coverage (PFA) can be computed from sea-ice measurements, meteorological data and a simple model • PFA correlates very well with areas of enhanced BrO if 1 day of transport is accounted for and enough light is available • This indicates correlation between frost flowers or conditions necessary for frost flowers and BrO BUT: So far no direct evidence for a role of frost flowers in Br release has been produced! Kaleschke, L. et al., Frost flowers on sea ice as a source of sea salt and their influence on tropospheric halogen chemistry, Geophys. Res. Lett.,31, L16114, doi:10.1029/2004GL020655, 2004.
Observed Changes in Sea Ice Extent • Sea ice extent in the NH has been declining since start of measurements • 2007 has set another dramatic record • this mostly affects summer, but also other seasons • the trend is expected to continue as the Arctic gets warmer http://nsidc.org/news/press/2007_seaiceminimum/20071001_pressrelease.html
Link to Climate Change? Ingredients needed for BrO explosion: • low temperatures • as temperatures increase in the Arctic, the region and time favourable for bromine explosions will change • fresh ice • as multi-year ice coverage decreases, the probability for frost flowers / first year ice will increase • sunlight • as cloud cover changes, so will photochemistry • a trigger • ??? O3 depletion in turn also effects radiative forcing locally with a potential for positive feedback
The Link between Bromine and Mercury • total gaseous mercury (TGM) is also depleted when ozone is depleted • this has been observed in both hemispheres (above: Neumayer Station) • reaction with BrO and HOBr is thought to be the main pathway Ebinghaus, R., et al., Antarctic Springtime Depletion of Atmospheric Mercury, Environ. Sci. Technol.,36(6), 1238-1244 , 2002
Effect on Mercury Chemistry Mercury in the atmosphere: • most mercury is of anthropogenic origin (> 70%, mainly combustion) • it is in the form of gaseous mercury Hg(0) Link between mercury and bromine: • reaction with BrO or HOBr can oxidize it to Hg(I) and Hg(II) which can deposit onto snow and ice => depletion of gaseous mercury importance of GEM depletion: • re-evaporation of Hg(0) is possible => no net effect • if not, mercury is injected into polar ecosystem during snow melt => bio-accumulation
Polar Mercury Chemistry Steffen et al., A synthesis of atmospheric mercury depletion event chemistry linking atmosphere, snow and water, Atmos. Chem. Phys. Discuss., 7, 10837–10931, 2007
Salt Lakes • salt lakes provide liquid and solid surfaces with very high salinity • measurements found extremely high BrO concentrations (up to 200 ppt) at the Dead Sea and also high BrO (up to 6 ppt) and ClO (5 – 15 ppt) at the Great Salt Lake in Utah and at Salar de Uyuni (Bolivia) • it is thought that the same heterogeneous release processes act for Br as in the polar BrO explosion (uptake of HOBr) • IO was also found at the Dead Sea, possibly related to bacterial emissions • rapid and strong ozone depletion is observed in air masses with high BrO • as saline soils cover more than 2% of the Earth’s surface, this might be a significant source of halogens in the troposphere • climate change induced desertification might even increase that
pollutionpeak BrO Observations at Dead Sea OMI BrO July 2005 BrO [ppt] O3 [ppb] NOx[ppb] SO2 [ppb] wind speed figure courtesy of T. Kurosu, SAO wind dir. Matveev V. et al., Bromine oxide–ozone interaction over the Dead Sea. J. Geophys. Res. 106, 10375–10387, 2001
Halogens in the marine Boundary Layer • oceans cover most of our planet • large concentrations of sea-salt aerosolsare present in the MBL • they are depleted in Cl and large aerosolsalso in Br while small particles are often enriched in Br • there is indication for reactive chlorine from different measurements (mist chamber measurements, hydrocarbon clock) but results are highly variable • there is indication for reactive bromine but again results are variable and point at rather low concentrations (< 1ppt) • in some regions, biological sources might be more relevant (=> see discussion on iodine later) • even at low concentrations, reactive halogens have an impact on ozone levels in the MBL and also on hydrocarbons => everything is still highly uncertain
A: removal of DMS BrO + DMS → Br + DMSO Br + O3 → BrO + O2 net: DMS + O3 → DMSO + O2 => reduction in DMS => reduction in SO2 available for new particle formation Halogen-Sulphur Interactions • cloud droplet formation depends critically on the availability of cloud condensation nuclei (CCN) • sulphate aerosols formed by SO2 can act as CCN • one major source of SO2 is biogenic dimethyl sulphate (DMS) BrO can interfere with sulphate production in two ways: B: increased uptake of SO2 oxidation of SO2 by HOCl (mainly aerosols) and HOBr (mainly cloud droplets) => reduction in SO2 available for new particle formation
Halogen-Sulphur Interactions von Glasow R. and Crutzen P. J. (2004) Model study of multiphase DMS oxidation with a focus on halogens. Atmos. Chem. Phys.,4, 589–608. • BrO in the marine boundary layer can have an impact on cloud processes and thus climate • large uncertainties remain in the details of the chemistry
Halogen Oxides and Volcanoes • volcanoes emit large quantities of hydrogen halides • eruptive emissions can reach the stratosphere, but no indication for enhanced Cl or Br • degassing emissions remain in the troposphere and appear to have very large BrO concentrations(up to 1 ppb), probably formedin the plume byphotochemistryand recyclingon aerosols SO2 BrO Bobrowski, N. et al., (2003), Detection of bromine monoxide from a volcanic plume Nature, 423, 273-276.
BrO and ClO Release from Volcanoes • ground-based MAX-DOAS measurements at Soufriere Hills volcano (and others) show tight correlation between SO2 and BrO emissions • the ratio SO2 / BrO was about 1000 at Soufriere Hills, smaller elsewhere • this corresponds to a global estimate of 146 Tg yr –1of sulphur emissions corresponding to a source strength of the order of 30,000 t Br yr -1 • volcanoes could be a significant source of BrO in the troposphere! BrO SO2 BrO ClO SO2 • Bobrowski, N. et al., (2003), Detection of bromine monoxide from a volcanic plume Nature, 423, 273-276. • Lee et al., High ClO and ozone depletion observed in the plume of Sakurajima volcano, Japan , Geophys. Res. Lett., 32, L21809, doi:10.1029/2005GL023785
BrO Release from Volcanoes: Satellite View Nyamuragira: 1.41°S, 29.20°E Summit elevation 3,058m • satellite measurements from GOME and SCIAMACHY offer global coverage • sensitivity is decreasing towards surface but large at plume altitude • large eruptions can be measured with good relative accuracy • no evidence for BrO enhancements found in any case Afe, O. T., et al., BrO Emission from Volcanoes - a Survey using GOME and SCIAMACHY Measurements, Geophys. Res.Lett., 31, L24113, doi:10.1029/2004GL020994, 2004
SCIAMACHY GOME BrO Release from Volcanoes: Satellite View => no indication for 1:1000 BrO / SO2 emissions during large volcanic eruptions => BrO emission / production limited to degassing Afe, O. T., et al., BrO Emission from Volcanoes - a Survey using GOME and SCIAMACHY Measurements, Geophys. Res.Lett., 31, L24113, doi:10.1029/2004GL020994, 2004
The Mystery of BrO in the free Troposphere satellite geometry • since GOME satellite measurements of BrO columns became available in 1995, it was clear that they are larger everywhere than expected from stratospheric BrO alone • this is interpreted as indication for about 0.5 – 2 ppt of BrO in the free troposphere • balloon borne and ground-based measurements confirmed this finding • some SH DOAS measurements show less BrO stratosphere free troposphereboundary layer van Roozendael, M.et al., : Intercomparison of BrO Measurements from ERS-2 GOME, ground-based and Balloon Platforms, Adv. Space Res., 29(11), 1661-1666, 2002
BrO in the free Troposphere MAX-DOAS geometry • ground-based and satellite measurements can be made consistent if a tropospheric background is assumed • sources are not clear but could include • photolysis of organohalogens • release from sea salt aerosols • emissions from volcanoes • export of polar BrO • import from stratosphere • even such small BrO amounts have a large (5 – 40%) effect on ozone levels in the free troposphere => still under investigation stratosphere free troposphereboundary layer with tropospheric BrO no tropospheric BrO N. Theys et al., Retrieval of stratospheric and tropospheric BrO columns from multi-axis DOAS measurements at Reunion Island (21 S, 56 E), Atmos. Chem. Phys.,7, 4733–4749, 2007
Iodine in the marine Boundary Layer long-path DOAS geometry • phytoplankton and macroalgae emit alkyl iodides (CH3I, C3H7I, CH2Cl I, CH2I2) and I2 • photolysis produces I which then attacks O3 • largest emissions are expected in biological active regions (coastal regions at low tide when seaweed is exposed, upwelling regions, polar regions) • IO could be observed during day and OIO and I2 mainly at night • more recent measurements in the Bay of Maine found IO, OIO and I2 during daytime also IO Carpenter L. J. et al., Coastal zone production of IO precursors: a 2-dimensional study. Atmos. Chem. Phys. 1, 9–18, 2001
low tide time of day Iodine and Particle Formation • during periods of high IO, large particle concentrations are observed • low tide and solar illumination needed, I2 or CH2I2 as precursors • new particles formed through iodine oxides (IO, OIO, I2O2,I2O3, ...) • very large concentrations needed => hot spots? • this could be a relevant mechanisms for new particle formation in addition to sulphate CCN particle concentration O’Dowd C. D. et al., A dedicated study of new particle formation and fate in the coastal environment (PARFORCE): overview of objectives and achievements. J. Geophys. Res. 107, 8108, 2002
Polar Iodine Oxide • MAX-DOAS measurements in Ny-Ålesund (Arctic) and Neymayer station (Antarctica) indicate enhanced IO concentrations in Polar Regions • long-path DOAS measurements at Halley Bay, Antarctica showed large IO concentrations highly correlated with BrO • sources of IO could be photolysis of iodocarbons produced by phytoplankton • recycling of IO on aerosols? • at these concentrations, IO dominates O3 loss • uptake of IO could also trigger Br release and start bromine explosion A. Saiz-Lopez et al.,Boundary Layer Halogens in Coastal Antarctica, 317, Science, 348, 2007
Satellite Observations of Antarctic IO • satellite measurements confirm presence of IO in spring in Antarctica • extended area close to Halley Bay • seasonality agrees with ground-based measurements • spatial distribution differs from that of BrO • no detectable signal in the Arctic • different release mechanisms must be involved (biological sources?) • Halley Bay measurements may not be representative for Polar Regions in general IO BrO Schönhardt, A.et al., Observations of iodine monoxide (IO) columns from satellite, Atmos. Chem. Phys. Discuss.,7, 12959-12999, 2007
Summary • halogen oxides play an important role in many aspects of tropospheric chemistry • in contrast to the stratosphere, they are mainly of natural origin • regions with large halogen oxide concentrations are the polar spring boundary layer, salt lakes, volcanoes and the marine boundary layer • halogen oxides reduce ozone levels, at high concentrations dramatically, e.g. during ODEs in Polar Regions • bromine converts gaseous mercury to particulate form which can lead to bioaccumulation • bromine potentially reduces new particle formation by H2SO4 • iodine can form new particles at high concentrations => many of the mechanisms and explanations shown are still highly uncertain!
Overview on Tropospheric Halogen Chemistry von Glasow, R. and P. J. Crutzen, Tropospheric Halogen Chemistry, Holland H. D. and Turekian K. K. (eds), Treatise on Geochemistry Update1, vol. 4.02, pp 1 - 67, 2007
Some References • von Glasow, R. and P. J. Crutzen, Tropospheric Halogen Chemistry, Holland H. D. and Turekian K. K. (eds), Treatise on Geochemistry Update1, vol. 4.02, pp 1 - 67, 2007 • Platt U. and G. Hönninger, The role of halogen species in the troposphere. Chemosphere, 52, 325–338, 2002 • Simpson et al., Halogens and their role in polar boundary-layer ozone depletion, Atmos. Chem. Phys., 7, 4375-4418, 2007 (http://www.atmos-chem-phys.net/7/4375/2007/acp-7-4375-2007.pdf) • Wayne et al., Halogen oxides: radicals, sources and reservoirs in the laboratory and atmosphere, Atmos. Environ., 29, 2677-2884, 1995