Download
1 / 1
10 likes | 101 Vues
Study compares global and regional climate models to assess wintertime precipitation in California. Results suggest regional models overpredict, while global models tend to be too weak. Methodology and findings are detailed in this research.

E N D
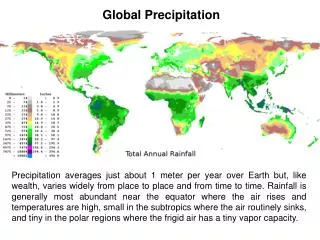
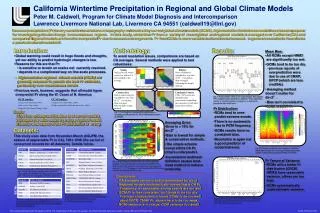
California Wintertime Precipitation in Regional and Global Climate Models Peter M. Caldwell, Program for Climate Model Diagnosis and Intercomparison Lawrence Livermore National Lab, Livermore CA 94551 (caldwell19@llnl.gov) Because precipitation (Pr) is very sensitive to variations in topography not resolved by current global climate models (GCMS), high-resolution limited-area models have become popular for investigating climate change in mountainous regions. In this study, wintertime Pr from a variety of recent global and regional models is averaged over California (CA) and compared. Regional models are found to overpredict Pr due to excessive strong events. Pr from GCMs is more variable, but tends to be too weak. In general, resolution is found to be a poor indicator of model skill. • Introduction: • Global warming could result in huge floods and droughts, yet our ability to predict hydrologic changes is low. • Reasons for this are that Pr: • is sensitive to terrain on scales not currently resolved. • depends in a complicated way on fine-scale processes. • → High-resolution regional climate models (RCMs) are generally assumed to provide the best Pr estimates, particularly over mountainous terrain. • Previous work, however, suggests that all model types overpredict Pr along the W. Coast of N. America: • Goals: • Test how widespread this bias is in current models. • Evaluate the value added by using a regional model. • Identify what aspect of the Pr distribution is wrong. • Datasets: • This study uses data from November-March (NDJFM, the season of appreciable Pr in CA), 1981-1998 (the period of concurrent records for all datasets). Details follow. Methodology: To avoid resolution issues, comparisons are based on CA averages. Several methods were applied to test robustness: Results: • Mean Bias: • All RCMs except HRM3 are significantly too wet. • GCMs tend to be too dry. • previous reports of overprediction were due to use of CMAP, GPCP (which are less credible). • Averaging method doesn’t matter for dx<3°. • Bias isn’t correlated to model resolution. Model Resolution (degrees) Simple Only grid cells whose center lies within CA are included in the average. Bilinear Data is bilinearly regridded to very fine (0.25°) resolution, then averaged following the simple method. Conservative Data is conservatively regridded to very fine (0.25°) resolution, then averaged following the simple method. Landmask/Conserv Cells >50% ocean are masked before conservative regridding for consistency with land-based observations. Fig. 3: Pr bias (model – NOAA) for various datasets. Bars indicate 95% confidence intervals based on a t-statistic. Where applicable, number of ensemble members averaged over is indicated in parentheses after model name. • Pr Distribution: • RCMs tend to over-predict extreme events. • There is no systematic bias in RCM frequency. • GCMs results have no consistent bias. • Resolution is again not a good predictor of model behavior. Model Resolution (degrees) Fig. 1: CA averages are constructed for each method by averaging over all colored cells. The CNRM model is used as an example. Model Resolution (degrees) • Averaging Error: • Error is < 10% for dx<3°. • Bias is lowest for simple & conservative methods. • The simple scheme overpredicts CA Pr, others underpredict. • Inconsistent landmask definition causes land-mask method to behave erratically. 1.12 1.40 1.56 1.87 2.26 2.80 2.80 2.80 2.80 3.14 4.50 4.50 Fig. 4:Pr frequency (blue line) and cumulative probability distribution (in color) for CA-average Pr using conservative method. Vertical lines separate obs, RCMs, and GCMs. Obs Model Resolution (degrees) • Pr Temporal Variance: • RCMs with a better Pr distribution (CRCM, HRM3) have reasonable variance, others are too high. • GCMs systematically underestimate variance. Fig. 2: Error induced on each GCM by the various regridding methods. This is calculated by conservatively regridding every RCM to each GCM grid, then computing CA averages using each method. A “+” (“-”) is drawn over each box where the GCM average is greater (less) than the RCM average. GCMs All obs use gauge data, CMAP and GPCP also use satellite data. NOAA uses the most stations, followed by UW, CRU, and finally CMAP/GPCP (which use the same gauge data). UW corrects for topography, GPCP for undercatch. • Conclusions: • CA averages can be robustly determined for dx<3°. • Regional models systematically overestimate CA Pr. • Frequency is reasonable, strong events are too wet. • GCM Pr is less consistent, but tends to be too dry. • Previous studies (which found GCMs to be too wet) used GPCP, CMAP Pr, shown here to be too weak. • RCM variance is too large, GCM variance too small. RCMs GCM data comes from the Atmospheric Model Intercomparison Project data from the Coupled Model Intercomparison (CMIP3) archive (www-pcmdi.llnl.gov/ipcc/about_ipcc.php). Fig. 5:Standard deviation of NDJFM-average Pr (circles) and of daily data within NDJFM (triangles). Daily values for datasets with only monthly data are set to zero. RCM data comes from North American Regional Climate Change Assessment Program (NARCCAP; narccap.ucar.edu) model runs forced by the National Center for Environmental Prediction Reanalysis II. This work performed under the auspices of the U.S. Department of Energy by Lawrence Livermore National Laboratory under Contract DE-AC52-07NA27344. LLNL-POST-413553