Unit II: Population Ecology
Unit II: Population Ecology. A. Single-species population growth B. Predator-prey interactions (Trophic levels) C. Interspecific competition D. Mutualism (positive interactions). Outline to trophic level lectures Ch. 14. 0. Introduction to population interactions (2 species)

Unit II: Population Ecology
E N D
Presentation Transcript
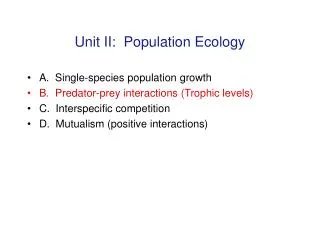
Unit II: Population Ecology • A. Single-species population growth • B. Predator-prey interactions (Trophic levels) • C. Interspecific competition • D. Mutualism (positive interactions)
Outline to trophic level lectures Ch. 14 • 0. Introduction to population interactions (2 species) • I. Introduction to 2-trophic level interactions (exploitation) • A. Background: premises and terms • B. Patterns in nature: ?Hypotheses • II. Simple models • A. Form of model • B. Functional Responses • C. Behavior of model • III. Realistic refinements of model • A. Prey K • 1. Paradox of enrichment • 2. Predator regulation of prey and predator efficiency • B. Time lags: predator-prey instrinsic time scales
Extinction Simple systems 1 predator-1 prey New predators Humans Invading species Coexistence Stable equilibrium Prey regulated by predator Cycles Prey still regulated? but not as stable Predictable periods Outcome of real 2-trophic level interactions Review
Verbal explanation of a simple model (Volterra model) Lower trophic level: population 1 Change in size of population 1 Rate of growth of population 1in the absence of population 2 “Functional response”: per predator capture rate = - Number of predators x Lower trophic level: population 2 Change in size of population 2 “Numerical response”: Functional response x conversion of prey into offspring Number of predators - Deaths of predators in absence of population 1 = x
Simplest Volterra Predator Prey model: Deaths due to predation Predator birth rate # of predators Predator “functional response” Prey exponential growth Predation rate Rate at which Prey are converted to Predator offspring Predator death rate Prey (LTL): dN/dt = rN - aNP dkilled=aP dN/dt = (bprey- dother)N - dkN Predator (UTL): dP/dt = caNP - dpredP dP/dt = (bpred-dpred)P bp=caN
Simplest Volterra Predator Prey model: Molles notation Deaths due to predation Predator birth rate # of predators Predator “functional response” Prey exponential growth Predation rate Rate at which Prey are converted to Predator offspring Predator death rate Prey (LTL): dNh/dt = rNh - pNhNp dkilled=pNp dNh/dt = (bprey- dother)Nh - dkNh Predator (UTL): dNp/dt = cpNhNp - dpNp dP/dt = (bpred-dpred)P bpred=cpNh
Lower trophic level dynamics Exponential growth Deaths due to predation or parasitism Number of predators Predator “functional response” Predation rate • Assumptions of the simplest model: • Prey are limited only by predators • Predation occurs by “mass action” – random contact of predator and prey in homogeneous environment • No predator satiation
Functional responsePer predator response to prey density TYPE I Predator does NOT satiate (i.e., dotted line) # prey eaten per predator aN Per predator rate of predation as a FUNCTION of prey density Prey density N The functional response in our basic model is the simplest type I… predation rate x number of prey (aN) Type I FR is a straight line with slope a and intercept at zero.
Three types of functional response Maybe in real life all predators satiate, BUT in the simple Volterra model with Type I FR, there is NO predator satiation. The Type I FR does NOT level off as in Fig. 6.21
Upper trophic level dynamics Deaths due to predation or parasitism Rate of conversion of prey into predator offspring Death rate of predator • Assumptions of the simplest model: • No predator carrying capacity (exponential growth if caN > dp) • Births a direction function of number of prey captured • Constant death rate • Predator is specialist, consumes only this prey species
Assumptions of the simple model: Summary • Growth of the prey population is limited only by predation [dN/dt = rN is the basis for population growth without the predator] • The predator is a specialist that can persist only if the prey population is present. [predator per individual birth rate is given as only bp=caN] • Individual predators can consume an infinite number of prey.[linear functional response, aN] • Predator and prey encounter one another randomly a homogeneous environment. [aNP term determines both prey deaths and predator births]
Analysis of the model • OK, so we have the simplest possible representation of how two populations might interact as predator and prey. • Now what? • In the case of the foraging model, we plugged in some numbers to analyze it. • In this case, we’ll try to be more general. • We want to solve the two equations at EQUILIBRIUM. • When both populations are at steady state (not increasing or decreasing in size, then: • Do predator and prey coexist? N* > 0 AND P* > 0 • Do predators regulate the prey population? N* < K
Analysis of the model:Solve the prey population at equilibrium To solve for equilibrium: dN/dt = rN - aNP = 0 rN - aNP = 0 rN = aNP r = aP The PREY population dynamics give us the equilbrium population size of PREDATORS. The predator population size depends ENTIRELY on the prey population dynamics
Analysis of the model: Solve the predator population at equilibrium To solve for equilibrium: dP/dt = caNP - dP = 0 caNP = dPcaN = d The PREDATOR population dynamics give us the equilibrium population size of PREY. The prey population size depends ENTIRELY on the predator population dynamics
Analysis of the model: phase planes We can solve these two equations at joint equilibrium using math, but we can quickly see the solution by looking at a graph known as a PHASE PLANE. This graph plots the density of the predator population against the density of the prey population to see how the densities of the two populations depend on each other. Number of predators (P) ????? Number of prey (N)
Analysis of the model:Plotting the prey population zero growth isocline 1st step: find the equilibrium solution for each equation (dN/dt = 0, dP/dt = 0) Number of predators (P) Prey population size decreases when predators are above equilibrium P*= r/a Prey population size inccreases when predators are below equilibrium “Prey ZPG isocline” Number of prey (N)
Analysis of the model:Plotting the predator population zero growth isocline 1st step: find the equilibrium solution for each equation (dN/dt = 0, dP/dt = 0) Number of predators (P) Predators decrease when prey pop size is below equilibrium Predators increase when prey pop size is above equilibrium “Predator ZPG isocline” N*=dp/(cp) Number of prey (N)
Phase plane analysis of predator and prey ZPG isoclines Neutrally stable equilibrium depends on starting conditions dP/dt = 0 # of preds (P) r/p dN/dt = 0 dp/ ac # of prey (N)
What the phase plane plot (N v. P) looks line when N,P are plotted against time Prey Predators
Neutral stability is a pathological property of models, like the frictionless pendulum Nevertheless, the simple model reveals the inherent tendency of 2TL interactions to cycle Prey N Consumer Oscillations occur that depend entirely upon initial conditions are and are not resilient (return to equilibrium after disturbance, i.e. not TRUE stability) http://www.sumanasinc.com/webcontent/anisamples/biogeography.html
Simplest Volterra model reveals the inherent tendency of 2-trophic-level interactions to cycle • This cycling is because of the inherent density dependence: prey population density depends on predator population density and vice versa • Prey deaths = aP and predator births = caN with an implicit time lag • Any kind of time lag can cause populations to cycle because the population’s growth rate is “reacting” to density at an earlier time. Population sizes can “overshoot” conditions at the time.
Add prey density dependence: Are we done? No--the simplest Volterra model is neutrally stable, which is not satisfying as a model. We want to put more real biology into the model and see what happens. Now the prey have a carrying capacity in the absence of predators: 2 possible sources of population regulation
Add prey carrying capacity to the model Increasing prey density decreases population growth rate Empirically derived constant: k=r/K Prey now has 2 kinds of DD mortality: dependent on predator density and prey density. Effect is to stabilize the prey population size (prevents exponential growth when predators are rare)
Add prey carrying capacity to the modeland re-solve for equilibrium Now predator equilibrium population size depends on prey density too, and not just on prey population per capita vital rates (r)
Phase plane analysis of predator-prey interaction with prey K Setting a ‘K’ means prey populations hit a “ceiling” and oscillations are dampened to the point of producing a stable equilibrium dP/dt = 0 r/p # of preds (P) dN/dt = 0 Note at equilibrium N < K: predators regulate prey dp/ ac # of prey (N) prey N=K
Population size (N) Time (t) Phase plane to time plot: Prey K • “Damping oscillations” to stable equilibria, N*, P* • Populations have a natural tendency to cycle because of the mutual density dependence BUT • Prey carrying capacity puts a “ceiling” on the cycling, causing them to fade away
“Paradox of enrichment” in the predator-prey interaction with prey K As K varies, the influence of this “ceiling” gets larger or smaller dP/dt = 0 r/p # of preds (P) dN/dt = 0 K3 K2 dp/ ac K1 # of prey (N)
From small to large K, the oscillations increase until they return to cycle For simplicity only 1 population is drawn
“Paradox” of enrichment • In a human value system, enrichment is “good,” cycles = instability is “bad” ergo “paradox” • Example of fertilizer runoff pollution, eutrophication, large population cycles of plankton and extinction.
Evidence for Paradox of Enrichment As N, P increases from pollution
Paradox of the paradox of enrichment • The P of E is easy to obtain in model systems but has only been demonstrated in a few experimental and observational studies. • Often the PofE does not occur with enrichment: • Populations stay stable • No extinction occurs • Species diversity of prey and predators does not decrease • Still, studies continue to provide evidence for the PofE in some natural systems.
Paradox of the paradox of enrichment • Mechanisms for stability in predator prey systems: • Type III functional responses • Spatial heterogeneity • Temporal variability (such as plankton vertical migrations) • Weak Allee effects • Stage structure and cannibalism (large predators eat smaller and younger individuals of the same species= self-regulation) • Trophic heterogeneity: edible and inedible prey mixed • Fast regeneration rate of lowest trophic level (plants) in 3-trophic level interactions, with the herbivore as the prey of the predators • Red Queen effects, if coevolution occurs quickly enough (generation time scale of both natural selection and population dynamics) and if time scales differ for the two populations • Artifacts of fatally unrealistic models
Phase plane analysis of predator-prey interaction varying predator efficiency a Although K stays the same, increasing predator efficiency mimics the paradox of enrichment. dP/dt = 0 r/p # of preds (P) dN/dt = 0 The more efficient (larger a) the predator, the more cyclic (unstable) the interaction dp/ ac Large a Small a # of prey (N) prey N=K
Huffaker’s mites in an orange universe experiment Fig. 14.20 Prey dispersed aerially & by crawling Predators dispersed by crawling only, movement slowed by partial barriers This experiment has multiple interpretations, including: Without the barriers, “a” is so high, predators drive prey to extinction. With barriers, “a” is lower, producing coexistence with cycles.
Wolves eating moose More refinements: realistic functional response Type II FR is most common Moose eating plants
ZPG isoclines intersect: Type II FR or Allee effect and Prey K dP/dt = 0 Perpendicularly = neutral stability Stable limit cycle = damping oscillations Number of predators (P) dN/dt = 0 dp/(ac) K Prey doesn’t increase above a given threshold The effect of a Type II FR or Allee effect means that the prey percapita population growth rate is depressed when prey are rare Number of prey (V)
Stable limit cycle: after a disturbance, the population size trajectories return to the same period and amplitude as before Prey Predators The common cycles might be a SLC of this etiology.
More realistic functional responses: Type III FR • A Type III functional response can be caused by two common features of real predator-prey systems: • Prey hiding places; • “Prey switching” DEF: when the per capita capture rate is lower at low prey densities, because predators are eating other types of prey.
Type III Functional Responses and effects on predator-prey interactions • Type III functional responses are very stabilizing to predator-prey interactions; • This FR causes prey to have a “refuge” from predation when they are rare. • Extinction is prevented • Oscillations are damped
Relative time scale of populations • Time lags can be implicit/instrinsic or explicit/extrinsic • Implicit or intrinsic are caused by the relative scaling of the vital rates of the two trophic levels • rprey >> rpred means that the prey population can respond much more quickly to the predator population than vice versa (or rprey << rpred ) • This causes a system delay that can result in “overshooting”, that is predators are responding to prey density at an earlier time (or vice versa)
Relative time scale of populations • Time lags can be implicit/instrinsic or explicit/extrinsic • Explicit or extrinsic are caused by periodicity in the environment, such as seasons (a breeding season and non breeding season) Time lag t is in the density dependence mechanism, such as feedback from the implied prey population, because of seasonal changes in resource renewal
“small” rt “medium” rt damped oscillations Low rate of increase or small time lag Amplitude(increases with rt) “large” rt stable limit cycle High rate of increase or large time lag Period ( 4t)
Patterns in cycling populations • Population cycles are more common: • At high latitudes (strong seasonality) Period ( 4t) • Time lag of 9 months ~ 3-4 year cycle • Time lag of 2+ years ~ 9-10 year cycle • Simple food chains (predator depends on one or few prey) at high latitudes or on islands (Unit III) • Big differences in intrinsic population growth rates between the two trophic levels • Hare fast, lynx slow • Lemmings fast, plants or weasels slow