Comprehensive Environmental Monitoring and Data Services by NEODAAS
NEODAAS (National Earth Observation Data Archive and Analysis Service) provides essential data for marine, terrestrial, and atmospheric applications. Leveraging advanced satellite imagery and real-time data processing, NEODAAS supports research and monitoring of meteorological phenomena, vegetation indices, and environmental changes. Services include L1 and L2 atmospheric data, operational support for research cruises, and extensive archives exploited by various studies—ranging from volcanic eruptions to Arctic research. Educational outreach initiatives ensure public access to high-resolution imagery and data.

Comprehensive Environmental Monitoring and Data Services by NEODAAS
E N D
Presentation Transcript
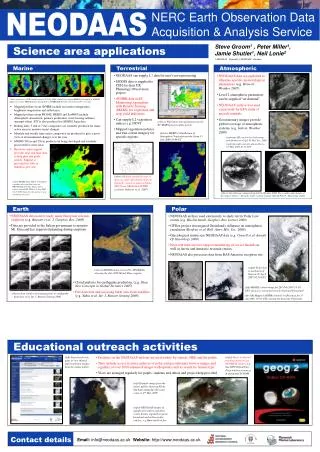
Contact details Email: info@neodaas.ac.uk Website: http://www.neodaas.ac.uk Steve Groom1 , Peter Miller1, Jamie Shutler1, Neil Lonie2 1 NEODAAS - Plymouth, 2 NEODAAS - Dundee. Science area applications Marine Terrestrial Atmospheric • NEODAAS can supply L1 data for user’s own processing • NEODAAS data are exploited to illustrate specific meteorological phenomena (e.g. Hisscott, Weather 2007) • Level 2 atmospheric parameters can be supplied “on demand” • NEODAAS archive was used extensively for ESA study of aircraft contrails • Geostationary images provide global coverage of atmospheric systems (e.g. Galvin, Weather 2008) • MODIS data is supplied to CEH for their UK Phenology Observatory project • AVHRR data in EC Monitoring Agriculture with Remote Sensing (MARS) for vegetation and crop yield indicators. • Can supply L2 vegetation indices e.g. NDVI • Mapped vegetation indicies and true-colour imagery for specific regions. 7 day composites of UK coastal waters 14th June 2006: (from left to right) MERIS chlorophyll-a, MODIS Aqua true colour, MODIS Aqua chlorophyll-a, AVHRR SST. Produced automatically every day. • Mapped products from AVHRR include sea surface temperature, brightness temperature and reflectance. • Mapped products from MODIS, MERIS and SeaWiFS include chlorophyll, attenuation, primary production, water leaving radiance, amongst others. SST is also produced for MODIS Aqua data. • Rolling daily, 3 and or 7 day composites are routinely produced for many active areas to monitor recent changes. • Monthly and weekly time series composites are produced to give a good view of environmental changes over the year. • MODIS 500 m and 250 m products are being developed and routinely processed for some areas. (above) Vegetation state parameters on the EC MARS project online portal (below) MERIS 1.2km Bottom of Atmosphere Vegetation product from 15 July 2006 10:44 UT. (right top) UK convective clouds image from Bennett et al, Q.J. R. Met. Soc. 2006 (right) Aircraft contrails obscure Iberia 31st Mar 2005 10:55 UTC • Research cruise support provides near real time data to help plan and guide cruises. Support is provided for 100s of ship/days per year. (above) Habitat suitability map of Spain to study distribution of great bustards - based on data including NDVI from NEODAAS AVHRR (courtesy Osborne et al., 2007). (right) MODIS Aqua 500 m chlorophyll a product developed in house at NEODAAS-plymouth. Image shows waters around SW UK for 4th Sep 2007 12:15 UTC. Data for this region is now routinely processed. (above) Geostationary images from Galvin, Weather 2008, The weather and climate of the tropics: Part 3 – Synoptic-scale weather systems (left) & Part 6 – Monsoons (right) Earth Polar • NEODAAS data used to study many European volcanic eruptions (e.g. Barsotti et al, J. Geophys. Res. 2008) • Data are provided to the Italian government to monitor Mt. Etna and has supported planning during eruptions • NEODAAS archive used extensively to study Arctic Polar Low events(e.g. Blechschmidt, Geophys. Res. Letters 2008) • GFDex project investigated Greenland's influence on atmospheric circulation (Renfrew et al, Bull. Amer. Met. Soc. 2008) • Glaciological studies use NEODAAS data (e.g. Greuell et al, Annals Of Glaciology 2006) • Near-real time services support monitoring of sea ice hazards as well as Arctic and Antarctic research cruises • NEODAAS also processes data from BAS Antarctic reception site (right) Polar Low to northwest of Norway 6th April 2007 10:56 UTC (above) MODIS image received by NEODAAS showing the July 2001 Mount Etna eruption • Cloud analysis for earthquake prediction, (e.g. Shou, New Concepts in Global Tectonics 2007) • Fire detection and assessing burnt area from wildfires (e.g. Yahia et al, Int. J. Remote Sensing 2008) (left) MODIS colour image for 26th Feb 2007 14:10 UTC shows ice extent between Iceland and Greenland (far left) Mapped AVHRR channel 1 reflectance for 1st Jan 2003 19:10 UTC around the Antarctic Peninsula (above) Iran cloud series images prior to earthquake - from Guo et al, Int. J. Remote Sensing 2008 Educational outreach activities (left) Typical selection page to view themed high resolution images from the online gallery • Facilities on the NEODAAS website are used widely by schools, HEIs and the public • They include access to entire archives of polar and geostationary browse images and a gallery of over 1000 enhanced images with options such as search by feature type • Visits are arranged regularly for pupils, students and others and project help provided (right) Many books and teaching materials use NEODAAS images, e.g. this 2009 Oxford Univ. Press teacher resources & planning CD-ROM (left) Example image from the online gallery showing North Sea haar along the UK’s east coast on 2nd May 2007 (right) NEODAAS images of significant weather and other events feature regularly in print, broadcast and online media articles, e.g. Buncefield oil fire