
SlideServe
Menu
Préférences
© SlideServe · v2026

Mastering Graph Interpretation in Economics with Expert Tutors

singaporeeconomicstutor avatar
2 diapositives · 47 Views · Nov 06, 2023

Some of the prominent examples include the demand and supply graph, the product market graph, the capital market graph, and many more. Understanding and interpreting these graphs can often make your head spin. Joining an economics tuition in Bukit Timah.
Mastering Graph Interpretation in Economics with Expert Tutors - slide 1
01 / 2Mastering Graph Interpretation in Economics with Expert Tutors
1 / 17

Télécharger la présentation

Mastering Graph Interpretation in Economics with Expert Tutors
Une image / un lien ci-dessous est fourni (tel quel) pour télécharger la présentation

Politique de téléchargement : le contenu du site vous est fourni TEL QUEL pour votre information et votre usage personnel ; il ne peut être vendu, concédé sous licence ni partagé sur d’autres sites sans l’accord de son auteur.Le contenu vous est fourni TEL QUEL, pour votre information et votre usage personnel uniquement. Téléchargez la présentation en cliquant sur ce lien. Lors du téléchargement, si vous ne parvenez pas à télécharger une présentation, l’éditeur a peut-être supprimé le fichier de son serveur.Pendant le téléchargement, si vous ne parvenez pas à obtenir une présentation, le fichier a peut-être été supprimé par l’éditeur.

F I N

Plus de contenu associé

Transcription de la présentation
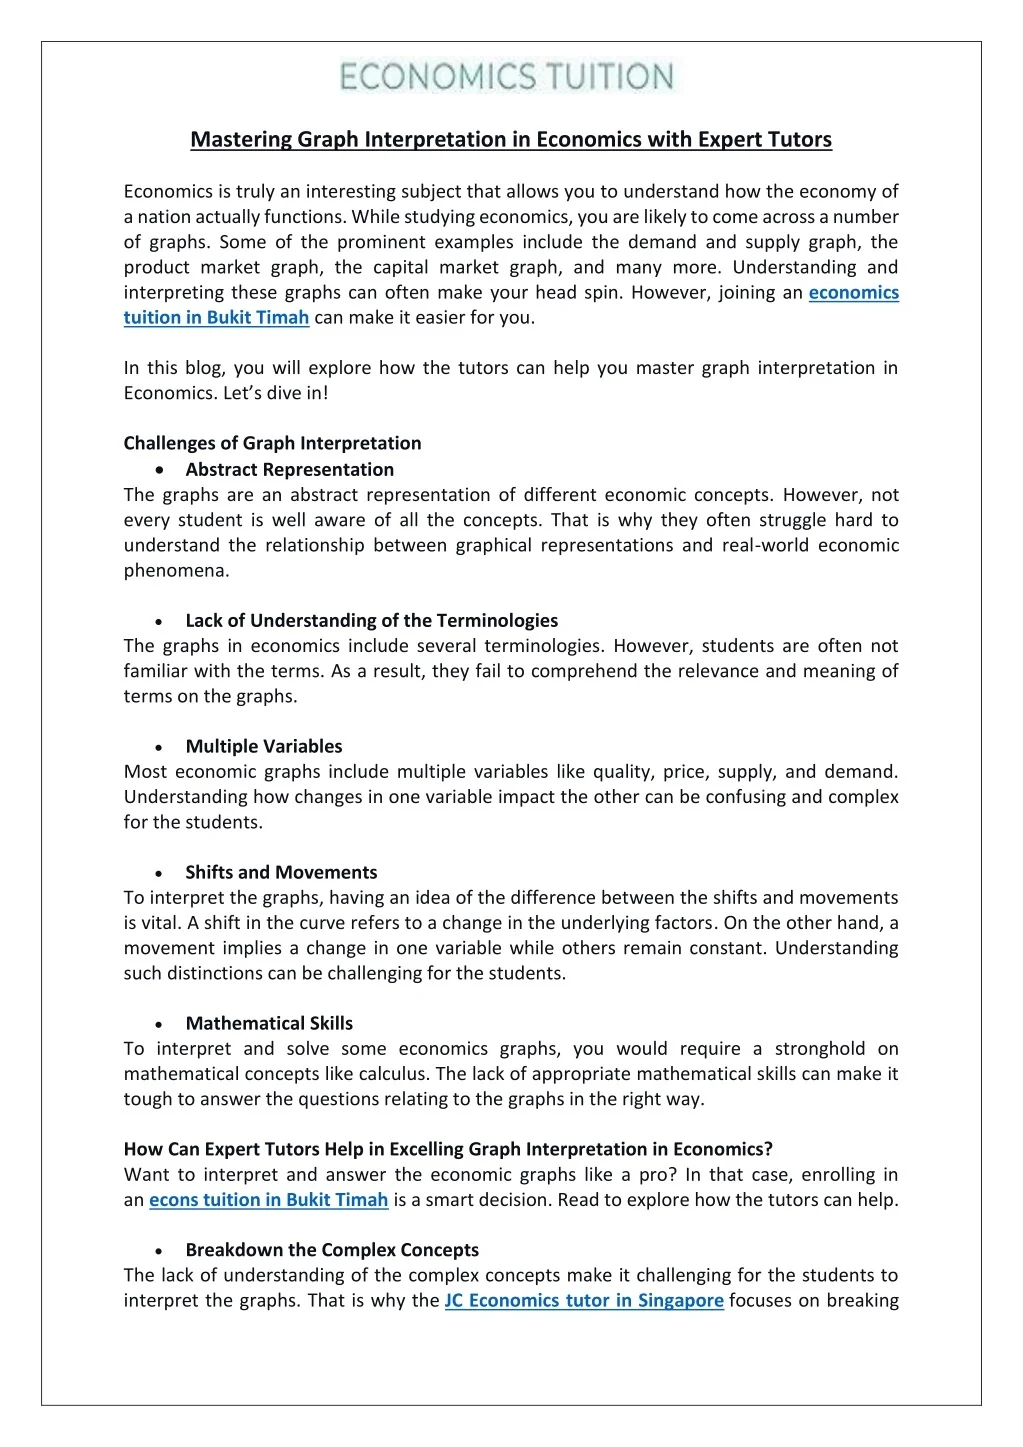
  1. Mastering Graph Interpretation in Economics with Expert Tutors Economics is truly an interesting subject that allows you to understand how the economy of a nation actually functions. While studying economics, you are likely to come across a number of graphs. Some of the prominent examples include the demand and supply graph, the product market graph, the capital market graph, and many more. Understanding and interpreting these graphs can often make your head spin. However, joining an economics tuition in Bukit Timah can make it easier for you. In this blog, you will explore how the tutors can help you master graph interpretation in Economics. Let’s dive in! Challenges of Graph Interpretation Abstract Representation The graphs are an abstract representation of different economic concepts. However, not every student is well aware of all the concepts. That is why they often struggle hard to understand the relationship between graphical representations and real-world economic phenomena. Lack of Understanding of the Terminologies The graphs in economics include several terminologies. However, students are often not familiar with the terms. As a result, they fail to comprehend the relevance and meaning of terms on the graphs. Multiple Variables Most economic graphs include multiple variables like quality, price, supply, and demand. Understanding how changes in one variable impact the other can be confusing and complex for the students. Shifts and Movements To interpret the graphs, having an idea of the difference between the shifts and movements is vital. A shift in the curve refers to a change in the underlying factors. On the other hand, a movement implies a change in one variable while others remain constant. Understanding such distinctions can be challenging for the students. Mathematical Skills To interpret and solve some economics graphs, you would require a stronghold on mathematical concepts like calculus. The lack of appropriate mathematical skills can make it tough to answer the questions relating to the graphs in the right way. How Can Expert Tutors Help in Excelling Graph Interpretation in Economics? Want to interpret and answer the economic graphs like a pro? In that case, enrolling in an econs tuition in Bukit Timah is a smart decision. Read to explore how the tutors can help. Breakdown the Complex Concepts The lack of understanding of the complex concepts make it challenging for the students to interpret the graphs. That is why the JC Economics tutor in Singapore focuses on breaking

  2. down the concepts into simple and easy-to-understand terms. As a result, the students can get a better grasp and be able to solve the graphs in much less time. Offer Real-World Examples Professional tutors make use of the real-world examples to help students understand the economics concepts better. It enables them to connect with the graphical representations effectively and answer the graph-related questions efficiently. Provide More Practice Opportunities The tutors provide the students with a chance to practice different types of graphs. As a result, they gain mastery in graph interpretation eventually and score higher grades in the subject. Conclusion Graph interpretation in economics may appear tricky at first. However, with the right guidance, it proves to be mark-fetching. Ready to master graph interpretation? In that case, it is time to join the JC Economics Education Centre. Known as the best A level economics tuition in Singapore, the experts are sure to offer you the best quality teaching for a bright career.