Download
1 / 1
10 likes | 95 Vues
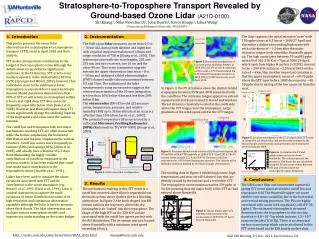
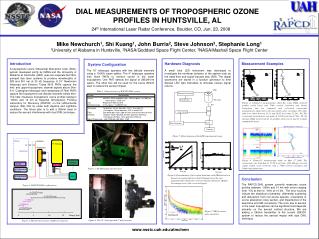
Development of a Differential Absorption Lidar system for ozone profiling, capable of measuring profiles from 500m to 10km, with a plan to reduce aerosol interference. Utilizing Nd:YAG-pumped dye lasers and various telescopes optimized for different altitude channels.

E N D
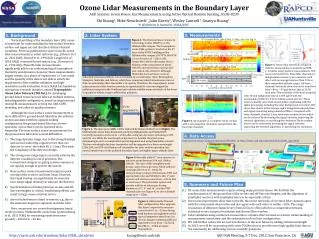
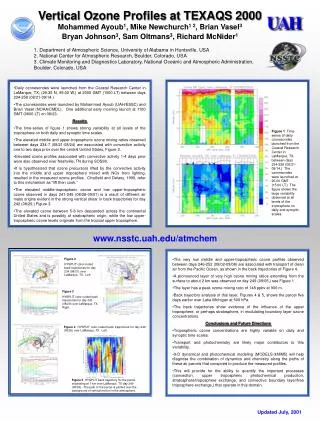
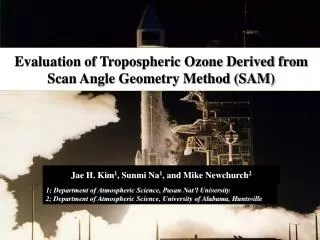
LED Function Generator Oscilloscope Telescope ND PMT Gate Circuit Licel Pulse Generator Computer Difference (%) Counts/sec Time (μs) Time (μs) SIB (Counts/sec) Background Time (μs) DIAL MEASUREMENTS OF TROPOSPHERIC OZONE PROFILES IN HUNTSVILLE, AL 24th International Laser Radar Conference, Boulder, CO, Jun. 23, 2008 Mike Newchurch1, Shi Kuang1, John Burris2, Steve Johnson3, Stephanie Long1 1University of Alabama in Huntsville, 2NASA/Goddard Space Flight Center, 3NASA/Mashall Space Flight Center Introduction A tropospheric ozone Differential Absorption Lidar (DIAL) system developed jointly by NASA and the University of Alabama at Huntsville (UAH) uses two separate Nd:YAG-pumped dye laser systems to produce wavelengths of 285 and 291 nm at 20 Hz frequency. A 16’’ Newtonian telescope and Electron Tubes 9813 PMTs capture the mid- and upper-tropospheric channel signals above 3km. A 4’’ Cassegrain telescope and Hamamatsu R7400 PMTs capture the tropospheric low-altitude channels below 4km. This lidar measures tropospheric ozone profiles between ~500m and 10 km at Regional Atmospheric Profiling Laboratory for Discovery (RAPCD) on the UAHuntsville campus (ASL 206 m) under both daytime and nighttime conditions. The future plan is to add a 266nm laser to reduce the aerosol interference with dual DIAL technique. Hardware Diagnosis A small blue LED instrument was developed to investigate the nonlinear behavior of the system such as the dead-time and signal-induced bias (SIB). The digital waveforms are stored in a function generator to emit desired LED light intensities to simulate various signal returns . Measurement Examples System Configuration The 16’’ telescope operates with two altitude channels using a 10/90% beam splitter. The 4’’ telescope operates with three PMTs to retrieve ozone in the lower troposphere. One PMT detects the signal of 285/291nm lasers. The other two will be used for the future 266nm laser to reduce the aerosol impact. Table 1. Characteristics of RAPCD-DIAL system Figure 8. Channel-5 measurements. (left) Ten ozone DIAL retrieval profiles (solid lines) with 750m vertical resolution and 30-min integration time are compared with co-located ozonesonde measurements (dash line) with uncertainty (gray envelope). The lidar data were taken between 11:13 and 16:42 local time 23 Dec. 06. The ozonesonde measurement was made at 13:00 local time 23 Dec. 06. (b) Average DIAL retrieval of the ten profiles shown in (a) and its 1-sigma standard deviation. 285 Figure 5. Block diagram of the LED experimental setup.. Future 4mJ/pulse 16” Telescope 266 285 291 291 4” Telescope 30mJ/Pulse 3 Gate 2 Figure 4. Channel-1 measurements made on May 17 2008. The ozonesonde was launched at 13:00 local time. (left) Range-corrected signal, (right) ozone retrievals with a 750m vertical resolution and 10min integration time. Computer Nd:YAG 1 Aft Optics 4 Figure 3. Nd:YAG pump and dye laser PMT Nd:YAG pumped Dye laser 5 Licel Figure 6. Determination of the system dead-time with LED driven by a linearly increasing function. (Left) Comparison of the raw, nonparalyzable-dead-time corrected signals and model. (Right) Percentage error of the corrected signal. Conclusion Nd:YAG pumped Dye laser The RAPCD-DIAL system currently measures ozone profiles between ~500m and 10 km with errors ranging from ~5% at 4km to ~60% at 10 km. The error sources include the statistical uncertainty, differential scattering and absorption from non-ozone species, uncertainty in ozone absorption cross section, and imperfection of the dead-time and SIB corrections. The error due to aerosol in the lower troposphere can be significant and depends primarily on the aerosol vertical structure. We are adding a 266nm transmitter to the current 285/291 system to reduce the aerosol impact with dual DIAL technique. Figure 1. RAPCD-DIAL configuration 4 (285/291nm) 5 (285/291nm) 3 (266nm) 2 (266nm) 1 (285/291nm) Figure 7. SIB of various pulse intensities. 0 5 10 15 Range (km) Figure 4. The 16’’ telescope and 4’’ mini receiver Figure 2. Measurement ranges of different channels www.nsstc.uah.edu/atmchem