Download
1 / 33
340 likes | 562 Vues
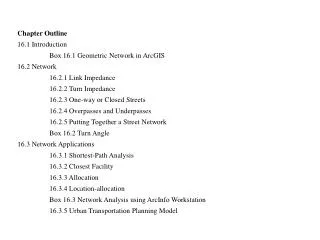
Chapter Outline 16.1 Introduction Box 16.1 Geometric Network in ArcGIS 16.2 Network 16.2.1 Link Impedance 16.2.2 Turn Impedance 16.2.3 One-way or Closed Streets 16.2.4 Overpasses and Underpasses 16.2.5 Putting Together a Street Network Box 16.2 Turn Angle 16.3 Network Applications

E N D
Chapter Outline 16.1 Introduction Box 16.1 Geometric Network in ArcGIS 16.2 Network 16.2.1 Link Impedance 16.2.2 Turn Impedance 16.2.3 One-way or Closed Streets 16.2.4 Overpasses and Underpasses 16.2.5 Putting Together a Street Network Box 16.2 Turn Angle 16.3 Network Applications 16.3.1 Shortest-Path Analysis 16.3.2 Closest Facility 16.3.3 Allocation 16.3.4 Location-allocation Box 16.3 Network Analysis using ArcInfo Workstation 16.3.5 Urban Transportation Planning Model
16.4 Dynamic Segmentation Box 16.4 Linear Location Referencing System 16.4.1 Create Routes on New Arcs 16.4.2 Create Routes on Existing Arcs 16.4.3 Create Different Types of Routes 16.4.4 Create Routes with Measured Polylines 16.5 Event Tables 16.5.1 Use Point or Polygon Coverages to Prepare Event Tables 16.5.2 Prepare Event Tables as INFO Files 16.6 Applications of Dynamic Segmentation 16.6.1 Data Query with Events 16.6.2 Data Analysis with Routes and Events
Applications: Network and Dynamic Segmentation Task 1: Display Point Events on a Route System in ArcMap Task 2: Create a Bike Route in ArcMap Task 3: Run Shortest-Path Analysis in ArcInfo Workstation Task 4: Run Allocation in ArcInfo Workstation Task 5: Create a Bike Route in ArcInfo Workstation
Possible turns at an intersection with four street segments. No U turns are allowed in this example.
First Ave E. Oak St. W. Oak St. First Ave. crosses Oak St. with an overpass. A non-planar representation with no nodes is used at the intersection of Oak St. and First Ave.
Street Name F-elev T-elev First Ave 0 1 First Ave 1 0 W. Oak St. 0 0 E. Oak St. 0 0 First Ave E. Oak St. W. Oak St. First Ave crosses Oak St with an overpass. A planar representation with two nodes is used at the intersection: one for First Ave, and the other for Oak St. The elevation value of 1 shows that the overpass is along First Ave.
node# arc1# arc2# angle minutes 341 503 467 90 0.500 341 503 466 0 0.250 341 503 465 -90 0.250 341 467 503 -90 0.250 341 467 466 90 0.500 341 467 465 0 0.250 341 466 503 0 0.250 341 466 467 -90 0.250 341 466 465 90 0.500 341 465 503 90 0.500 341 465 467 0 0.250 341 465 466 -90 0.250 466 465 467 341 503 Possible turns at node 341
node# arc1# arc2# angle minutes 265 339 342 -87.412 0.000 265 339 340 92.065 0.000 265 339 385 7.899 0.000 265 342 339 87.412 0.500 265 342 340 -0.523 0.250 265 342 385 -84.689 0.250 265 340 339 -92.065 0.250 265 340 342 0.523 0.250 265 340 385 95.834 0.500 265 385 339 -7.899 0.000 265 385 342 84.689 0.000 265 385 340 -95.834 0.000 385 342 340 265 339 Turn impedance values for turns at node 265 that has stop signs for the east-west traffic
node# arc1# arc2# angle minutes 339 467 501 90.190 0.500 339 467 462 1.152 0.250 339 467 461 -92.197 -1.000 339 462 501 -90.962 0.250 339 462 467 -1.152 0.250 339 462 461 86.651 -1.000 339 461 501 2.386 0.250 339 461 467 92.197 0.500 339 461 462 -86.651 0.250 461 462 467 339 501 Turn impedance values for turns at node 339. Node 339 is an intersection between a southbound one-way street and an east-west two-way street.
Shortest path from a street address in Moscow, Idaho to its closest fire station (shown by the square symbol)
Service areas of two fire stations within a 2-minute response time in Moscow, Idaho
Service areas of two fire stations within a 5-minute response time in Moscow, Idaho
Demand points in Latah County, Idaho for a public library location problem
Three candidates selected by the maximum covering model and the demand points served by the candidates
Three candidates selected by the minimum distance model and the demand points served by the candidates
One fixed and two selected candidates using the minimum distance model with the maximum distance constraint of 10 miles. The fixed candidate is the one to the west.
Because the bus route is a looping route, the route system is dissected into three sections.
A stream route system and a slope coverage with four slope classes
The linking of an event table (a), a route table (b), and a section table
This map displays the result from querying the event table (Year <= 1990)
This map displays the first 50-mile segment of Interstates 15, 84, 86, and 90
(1) (2) (3) (4) (5) (6) (1) 0 20 53 58 0 0 (2) 20 0 39 0 0 0 (3) 53 39 0 25 0 19 (4) 58 0 25 0 13 0 (5) 0 0 0 13 0 13 (6) 0 0 19 0 13 0 Table 16.1 The impedance matrix among 6 nodes
From-node To-node Shortest Path Minimum Cumulative impedance 1 2 p12 20 1 3 p13 53 1 4 p14 58 1 5 p14 + p45 71 1 6 p13 + p36 72 Table 16.2 Shortest paths from node 1 to all other nodes
inter# inter-id high_number 1 1 15 2 2 84 3 3 86 4 4 90 5 5 184 Table 16.3 The route table for the interstates in Idaho
routelink# arclink# f-meas t-meas f-pos t-pos inter# inter-id 1 5 0 44700 100 0 1 1 1 4 44700 123648 100 0 2 2 1 3 123648 199791 100 0 3 3 1 16 199791 239375 100 0 4 4 1 15 239375 315194 100 0 5 5 2 6 0 74024 0 100 6 6 2 7 74024 78964 0 100 7 7 2 9 78964 154873 0 100 8 8 2 10 154873 226153 0 100 9 9 2 11 226153 303050 0 100 10 10 2 12 303050 356992 0 100 11 11 2 17 356992 433769 0 100 12 12 2 18 433769 443570 0 100 13 13 3 13 0 78065 0 100 14 14 3 14 78065 101154 0 100 15 15 4 1 0 72033 0 100 16 16 4 2 72033 117974 0 100 17 17 5 8 0 6348 100 0 18 18 Table 16.4 The section table for the interstates in Idaho
usstations# bus# measure 1 1 899.930 2 1 2359.145 3 1 2476.239 4 1 2849.655 5 1 3163.485 6 1 4173.557 7 1 5446.844 8 1 6451.580 9 1 9368.944 10 1 8509.497 11 1 10002.686 12 1 10412.696 13 1 11728.987 Table 16.5 A point event table showing bus stops along the bus route
Table 16.6 A linear event table showing slope-code along a stream route (Emida-ID = 1)
inter-id from to year 1 44700 90000 1995 1 123648 180000 1989 1 239375 270000 1992 2 74024 78000 1988 2 154873 180000 1993 2 356992 400000 1987 3 78065 90000 1988 4 40000 72033 1986 Table 16.7 A linear event table showing year of pavement re-surfacing on the interstate highway route system
inter-id to unit 1 80465 1 1 160930 2 1 241395 3 1 315194 4 2 80465 1 2 160930 2 2 241395 3 2 321860 4 2 402325 5 2 443570 6 3 80465 1 3 101155 2 4 80465 1 4 117974 2 Table 16.8 A continuous event table dividing each interstate highway into 50-mile segments